Preparing For Launch
The runs have been raining down as of late, at least relative to the spongeball square offenses that we’ve had to suffer through during the first part of the season. Whether this is due to the increasing temperatures decreasing the overall effects that league-wide humidors have wrought, or to MLB more nefariously (definitely not) switching out the baseballs, doesn’t matter as much.
What does matter is that these dongs of summer are finally giving fantasy managers a respite in their offensive categories. With that in mind, let’s take some different looks at the so-called power hitters that have hurt their drafters the most through the first third of the season, starting with the ones most likely to turn things around.
We’ll split 2022 into two periods consisting of the first month of the season (which annoyingly started late so we have to steal a week from May) and the time since (with stats through June 12). Besides the raw home run rates, we’ll also look at the percentile ranks, as the raw rates are being significantly pushed on by the changes in the offensive environment. But with percentile ranks we can see how their rates have changed relative to their peers, framing the changes in way that are more separated from the overall drops in power.
Players will be grouped further as we go along but let’s start simply with just the players who’ve seen a drop in how often they’re hitting home runs compared to 2021. IE. You used to go deep this often but are completely tanking your fantasy value by now only going deep that often.
Here are the 77 players in 2022 who’ve seen a minimum 10-point drop in their HR per PA rates percentile ranks compared to in 2021:
| Player | 2021 PA | 2022 PA | 2021 HR/PA | 2022 HR/PA | HR/PA +/- | 2021 Percentile Rank | 2022 Percentile Rank | Rank +/- |
|---|---|---|---|---|---|---|---|---|
| Yasmani Grandal | 375 | 201 | .061 | .010 | -.051 | 93 | 12 | -82 |
| Austin Meadows | 591 | 135 | .046 | .000 | -.046 | 76 | 0 | -75 |
| Javier Báez | 547 | 194 | .057 | .015 | -.041 | 89 | 23 | -67 |
| Avisaíl García | 515 | 197 | .056 | .015 | -.041 | 87 | 22 | -66 |
| Elias Díaz | 371 | 155 | .049 | .013 | -.036 | 80 | 16 | -64 |
| Tyler O’Neill | 537 | 159 | .063 | .019 | -.044 | 95 | 32 | -63 |
| Franmil Reyes | 466 | 145 | .064 | .021 | -.044 | 96 | 37 | -59 |
| Jesse Winker | 485 | 255 | .049 | .016 | -.034 | 80 | 23 | -57 |
| Max Muncy | 592 | 184 | .061 | .022 | -.039 | 93 | 39 | -54 |
| Marcus Semien | 724 | 259 | .062 | .023 | -.039 | 94 | 42 | -52 |
| Robbie Grossman | 671 | 173 | .034 | .000 | -.034 | 51 | 0 | -51 |
| AJ Pollock | 422 | 159 | .050 | .019 | -.031 | 81 | 32 | -49 |
| Teoscar Hernández | 595 | 145 | .054 | .021 | -.033 | 85 | 37 | -48 |
| Adam Duvall | 555 | 222 | .068 | .027 | -.041 | 98 | 51 | -47 |
| César Hernández | 637 | 276 | .033 | .000 | -.033 | 47 | 0 | -47 |
| Joey Votto | 533 | 180 | .068 | .028 | -.040 | 97 | 52 | -45 |
| Andrew McCutchen | 574 | 210 | .047 | .019 | -.028 | 78 | 33 | -44 |
| Justin Turner | 612 | 231 | .044 | .017 | -.027 | 72 | 28 | -44 |
| Freddie Freeman | 695 | 269 | .045 | .019 | -.026 | 74 | 30 | -43 |
| Eduardo Escobar | 599 | 248 | .047 | .020 | -.027 | 77 | 35 | -41 |
| Lourdes Gurriel Jr. | 541 | 210 | .039 | .014 | -.025 | 61 | 20 | -41 |
| Wil Myers | 500 | 134 | .034 | .007 | -.027 | 50 | 9 | -41 |
| Nick Castellanos | 585 | 249 | .058 | .028 | -.030 | 92 | 53 | -39 |
| Darin Ruf 러프 | 312 | 203 | .051 | .025 | -.027 | 83 | 47 | -36 |
| Ryan McMahon | 596 | 244 | .039 | .016 | -.022 | 60 | 25 | -35 |
| Matt Olson | 673 | 270 | .058 | .030 | -.028 | 91 | 57 | -34 |
| Rafael Ortega | 330 | 167 | .033 | .012 | -.021 | 48 | 15 | -33 |
| Andrew Benintendi | 538 | 244 | .032 | .008 | -.023 | 44 | 11 | -33 |
| Bobby Dalbec | 453 | 176 | .055 | .028 | -.027 | 87 | 54 | -33 |
| Ramón Laureano | 378 | 127 | .037 | .016 | -.021 | 56 | 24 | -32 |
| Cedric Mullins | 675 | 266 | .044 | .023 | -.022 | 73 | 41 | -32 |
| Brandon Belt | 381 | 120 | .076 | .033 | -.043 | 100 | 68 | -32 |
| Josh Donaldson | 543 | 191 | .048 | .026 | -.022 | 79 | 48 | -31 |
| Ketel Marte | 374 | 235 | .037 | .017 | -.020 | 58 | 27 | -31 |
| Ryan Jeffers | 293 | 149 | .048 | .027 | -.021 | 79 | 49 | -30 |
| Jonathan Villar | 505 | 127 | .036 | .016 | -.020 | 54 | 24 | -30 |
| Lorenzo Cain | 286 | 148 | .028 | .007 | -.021 | 37 | 7 | -30 |
| Jorge Polanco | 644 | 250 | .051 | .028 | -.023 | 82 | 53 | -30 |
| Nelson Cruz | 584 | 235 | .055 | .030 | -.025 | 86 | 57 | -29 |
| Josh Bell | 568 | 256 | .048 | .027 | -.020 | 79 | 51 | -27 |
| Brandon Crawford | 549 | 212 | .044 | .024 | -.020 | 70 | 43 | -27 |
| J.T. Realmuto | 537 | 217 | .032 | .014 | -.018 | 44 | 18 | -26 |
| Dylan Carlson | 619 | 166 | .029 | .012 | -.017 | 41 | 15 | -25 |
| Enrique Hernández | 585 | 238 | .034 | .017 | -.017 | 51 | 27 | -24 |
| Garrett Cooper | 250 | 211 | .036 | .019 | -.017 | 54 | 32 | -22 |
| Andy Ibáñez | 272 | 128 | .026 | .008 | -.018 | 33 | 11 | -22 |
| Mike Zunino | 375 | 123 | .088 | .041 | -.047 | 100 | 78 | -22 |
| Yoshi Tsutsugo | 262 | 135 | .031 | .015 | -.016 | 43 | 21 | -22 |
| Brandon Lowe | 615 | 133 | .063 | .038 | -.026 | 95 | 74 | -21 |
| José Abreu | 659 | 245 | .046 | .029 | -.017 | 75 | 54 | -21 |
| Harrison Bader | 401 | 214 | .040 | .023 | -.017 | 62 | 42 | -20 |
| Trea Turner | 646 | 260 | .043 | .027 | -.016 | 69 | 50 | -19 |
| Mike Yastrzemski | 532 | 199 | .047 | .030 | -.017 | 77 | 58 | -19 |
| Miguel Cabrera | 526 | 196 | .029 | .015 | -.013 | 40 | 22 | -18 |
| Seth Brown | 307 | 196 | .065 | .041 | -.024 | 96 | 78 | -18 |
| Ian Happ | 535 | 230 | .047 | .030 | -.016 | 76 | 59 | -17 |
| Ronald Acuña Jr. | 360 | 145 | .067 | .041 | -.025 | 96 | 80 | -17 |
| Amed Rosario | 588 | 214 | .019 | .000 | -.019 | 17 | 0 | -17 |
| Tony Kemp | 397 | 225 | .020 | .004 | -.016 | 21 | 5 | -16 |
| Randal Grichuk | 545 | 195 | .040 | .026 | -.015 | 64 | 47 | -16 |
| Brett Phillips | 292 | 133 | .045 | .030 | -.014 | 73 | 58 | -15 |
| Tucker Barnhart | 388 | 129 | .018 | .000 | -.018 | 15 | 0 | -15 |
| Xander Bogaerts | 603 | 248 | .038 | .024 | -.014 | 59 | 44 | -15 |
| José Iglesias | 511 | 190 | .018 | .000 | -.018 | 15 | 0 | -15 |
| Frank Schwindel | 259 | 230 | .054 | .035 | -.019 | 85 | 71 | -15 |
| Salvador Perez | 665 | 204 | .072 | .044 | -.028 | 99 | 84 | -14 |
| Yuli Gurriel | 605 | 215 | .025 | .014 | -.011 | 31 | 19 | -12 |
| Carlos Santana | 659 | 173 | .029 | .017 | -.011 | 40 | 28 | -12 |
| Willi Castro | 450 | 135 | .020 | .007 | -.013 | 20 | 8 | -12 |
| Rhys Hoskins | 443 | 254 | .061 | .043 | -.018 | 93 | 82 | -11 |
| Dansby Swanson | 653 | 245 | .041 | .029 | -.013 | 65 | 54 | -11 |
| Jacob Stallings | 427 | 155 | .019 | .006 | -.012 | 18 | 7 | -11 |
| Luis Robert | 296 | 195 | .044 | .031 | -.013 | 71 | 61 | -11 |
| Trent Grisham | 527 | 226 | .028 | .018 | -.011 | 39 | 29 | -10 |
| Gary Sánchez | 440 | 189 | .052 | .037 | -.015 | 84 | 73 | -10 |
| Ozzie Albies | 686 | 260 | .044 | .031 | -.013 | 70 | 61 | -10 |
Franmil Reyes, CLE
- 2021: 30 HR – .064 HR per PA (96th percentile)
- 2022: 3 HR – .021 HR per PA (37th percentile)
Currently, on the IL with a hamstring strain, Franmil Reyes has a case for the power disappointment of the year. Three? Just three home runs?? How exactly does that track with his franimilistic past? But besides the decrease in his actual home run output, more concerning were the very significant changes in his top-end exit velocities compared to last season – a year in which they had already dropped in the second half.
In 2021, Reyes dropped from a 20.5% Brl% in the first half, to a 14.2% Brl% in the second half, with his Air% average exit velocity also dropping by 1.4 mph to 97.3 mph. Given that, it was natural to worry when he came out firing a 12.0% Brl% in the first period of 2022, with a 95.3 mph Air% average EV (down another 2 mph from the second half of 2021) and an elite 56% Air% (100+ mph) that had dropped to 39.1%. Not great.
But have hope! Because while Reyes only has 47 PA (with 27 BBE) in our second period (going on the IL on May 25), there were signs that the boomstick was waking up prior to his injury, even though he hasn’t hit a home run since May 7. However, even with a lack of jacks, Reyes posted a 22.2% Brl%, 103.0 mph Air% average EV, and a 66.7% Air% (100+ mph) over that short period – for context, those numbers, if qualified, would all be the best in baseball. It may be a small sample but those are the type of giant signs of life that can portend future power and, in Reyes’s case, wouldn’t be that far off from what we’ve seen in the very recent past.
It’s a shame that he had to get hurt when he did but all that should do is drive his price lower if one was inclined to make a move for him, with Reyes starting a rehab assignment on June 13. Coming back to warmer weather and higher scoring, the Franimal is one of my favorite picks to go on a summer power binge.
Adam Duvall, ATL
- 2021: 38 HR – .068 HR per PA (98th percentile)
- 2022: 6 HR – .027 HR per PA (51st percentile)
Adam Duvall crushed bombs in 2021. He crushed them in the first half (.066 HR/PA). He crushed them even more (.072 HR/PA) in the second half. The bugaboo, though, is his rate of hitting home runs may have gone up in the second half but some key exit velocities were going the other way.
Duvall averaged 96.0 mph on balls hit in the air in the first half of 2021 but came in at 93.5 mph in the second, with his Air% (100+ mph) also dropping five points. And things were down again in the first month of 2022, cratering down to a 91.2 mph Air% average EV and a 28.6% Air% (100+ mph). Those are some significant drops, going from rates in the top 10-15% down to ones below the 50th percentile.
While not up to the level of what he was clocking in the first half of 2021 (or even the second half), Duvall has definitely upped his big EVs as of late. He has a 14.3% Brl% in the second period (6.1% Brl% in the first period) of 2022, with a 94.1 mph Air% EV that is up three ticks, and a 35.7% Air% (100+ mph) is up seven points.
Duvall’s .045 HR/PA in the second period still isn’t what it was last year but things are finally at least heating up, with his 2-HR game on Sunday giving him a total of four* in his past seven games. And as the weather has been heating up, Duvall isn’t the only Brave popping off lately – Ronald Acuna Jr. and Austin Riley also have 4 HR each in June, with Ozzie Albies, Travis d’Arnaud, and William Contreras each kicking in another two. I’m not banking on a return to what he gave us in 2021 but his home rates don’t have to rise that much for Duvall to return a lot of powerful value ROS.
*correction: after hitting another one on Monday night, you can make that 5 HR in past eight games.
Gary Sanchez, NYY
- 2021: 23 HR – .052 HR per PA (84th percentile)
- 2022: 3 HR – .037 HR per PA (73rd percentile)
We’ll get into reasons to believe in Sanchez’s power returning to form but first, a note about his home run rates being a good example of how looking at percentile ranks can give us more information than just looking at the raw rates.
To get a sense of how the overall texture of home run rates has changed, notice that Sanchez’s rate in 2022 has fallen by 30% compared to 2021 but that has only moved him down 11 percentile points. IE. His home run rate would have looked pretty paltry in previous seasons but looks more impressive when judged through the lens of 2022’s offensive environment. For added context, his .037 HR/PA (73rd percentile) in 2022 would have slotted in around the 55th percentile in 2021 but on the flip side, his .052 HR/PA (84th percentile) from 2021 would rank in the 93rd percentile this season.
Like Reyes and Duvall, Sanchez also saw big drops in exit velocities over the second half of 2022 before some dropped even further at the start of 2022. But like the aforementioned pair, Sanchez has also rebounded in the second part of 2022. His Air% average EV of 97.4 mph is up from 93.7 mph in the first period of this season (which was around the same in the second half of last season), and is even topping his 96.5 mph mark from the first half of 2021. And an 11.4% Brl% from the first month has now been running at an elite 19.5% Brl% ever since.
Moving beyond the exit velocities, though, where Sanchez is hitting the ball has also been moving in a power-friendly direction. While still not north of 50% as it’s been the past two years, his 46.8% Pull% in the second period is up from 38.6% in the first but the launch angles are where the real goodness is, as Gary has tightened things up in a real way.
At first glance, the changes in his average launch angle between our two periods don’t seem very notable, with Sanchez only decreasing from 20.1 degrees to 17.2 degrees. But this is a great example of how looking at more than average LA can lead to further insight, just as looking at different subsets of exit velocity is more informative than just looking at average EV.
Sanchez’s average LA may have only dropped three degrees but this change seems more significant when looking at his distributions between the two periods:
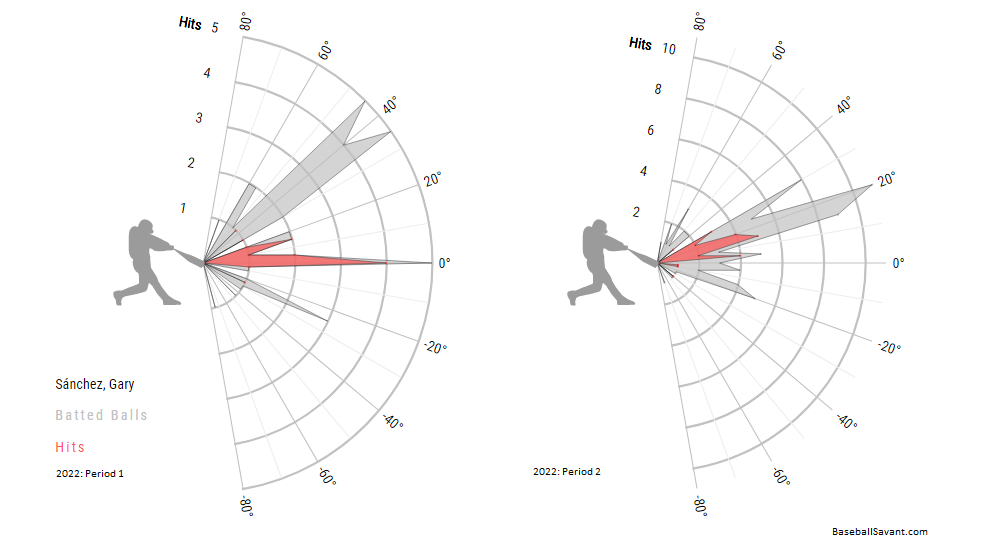
Immediately, you can notice that Sanchez’s hits in the second period are coming from angles that are way more friendly for power, with a majority coming in the 15-20 degree range, compared to sub-10 degrees in the first period. But in baseball, just as in life, we shouldn’t just focus on the positive results and neglect what’s happening in the negative space.
In order words, it’s not just what mistakes you make, it’s also how you’re making them. And in Sanchez’s case, most of his “mistakes” (outs) early in the season were being made in ways that they’re almost guaranteed to be self-fulfilling.
In the first period, Sanchez’s angles were such that they rendered his exit velocities moot, in regards to power. Like a bizzaro three-true outcomes of batted balls, a majority of his hits came at angles unlikely to generate enough loft to leave the park, and most of his outs were either pounded into the ground or skyed way too high to ultimately be damaging. But the tighter spread in the second period is apparent, with a majority of his batted balls (both hits and outs) coming in a range of angles that aren’t (almost necessarily) going to be outs.
Sanchez isn’t just hitting the ball harder, he’s also hitting it smarter in the second period of 2022 – more pulls, more balls in the air, more exit velocity, and at better angles. This is a recipe for powerful success. And while not specifically related, can we at least take a moment to appreciate his .213 AVG?
Sure, maybe that doesn’t seem impressive but relative to his sub-.200 history, a .213 AVG for Gary Sanchez is basically a gentleman’s .230.
This article was much appreciated. What is your take on Austin Meadows? Is the loss of power due to his vertigo issue, or is something deeper going on? I am not sure I believed in his two largest homerun seasons being his normal, but zero homers this year is a headscratcher?
Thank you for checking it out. I appreciate it.
Meadows actually got left on the cutting room floor…I’ve never been a big fan because of his issues with LHP but there are a lot of positive signs when comparing his EVs from the first and second periods of this year.
But while the EVs are much better, his Air% continues to drop – 63% in the first half of 2021, 57% in the second half, 56% in the first period of 2022, and now down to 48% in the second period.
And his home park (along with humidors/dead ball) is just killing him..I can’t add images on here but I just tweeted one of his spray chart from home overlayed in Tampa, which isn’t exactly a hitter’s park but probably still would’ve treated Meadows a lot better.