Premature Power Prognostications
It’s the beginning of May, so you know what that means – It’s time to make wild declarations based on the barest amount of evidence. Let me hear ya now; AY-PRIL! AY-PRIL! AY-PRIL!
I kid, I kid. Drawing definite conclusions after 25 games might be a fool’s errand but that doesn’t mean there aren’t tea leaves to be read in regards to what we’ve seen so far, as a plethora of minute data is available to try and parse what’s been real and what’s more fake. Take power, for example. There are all sorts of small-sample shenanigans driving the current home run totals but that doesn’t mean we can’t sort out some of the chaff and see what kind of home run bread might be getting baked during the rest of the season.
Let’s get things going, albeit at a medium pace. Or, rather, the on-pace HR numbers that players are currently tracking for. Our method is simple, though not perfect. On-pace HR =
2023 HR Rate (HR per PA) * Projected PA remaining (2023 PA/G * Projected Games remaining (2023 GP% * remaining team games))
Easy enough? Again, this isn’t perfect but remember, we don’t need to be since we’re just looking for a ballpark of expected home run production going forward and how it compares to what we’ve seen before – because (and I can’t stress this more) on-pace numbers DON’T REALLY MEAN ANYTHING BY THEMSELVES. They don’t. But that doesn’t mean they can’t be useful for identification purposes. We’re not trying to answer whether or not Max Muncy is going to challenge for the HR record (he won’t), we’re trying to figure out what, if anything, is driving his early-season power charge, whether those changes (if relevant) are sustainable, and what is a reasonable expectation for his rest-of-season production.
We’ll do this by taking a glance at a variety of metrics related to exit velocities, launch angles, plate discipline, and contact rates, to see what we can see, and also make some predictions. And since I’m also wearing my Touty McTouterson hat, we can’t just give a general “thumbs up!” or “thumbs down!” prediction for each batter…No, no, no – we’ll also need to make some way too specific predictions made with far too small sample sizes, so I’ll also give each player a Totally Official Executive Wild Ass Guess for what their 2023 HR total will ultimately be.
Enough supposition – onto the On-Pace HR Leaderboard!
Here are the players currently on pace for at least 20 HR (min 50 PA) in 2023:
| Player | 2023 HR | On Pace HR | 2022 HR | 2023 PA | On Pace PA | 2022 PA | 2023 hr/pa | 2022 hr/pa |
|---|---|---|---|---|---|---|---|---|
| Max Muncy | 11 | 69 | 21 | 90 | 137 | 565 | .122 | .037 |
| Pete Alonso | 10 | 62 | 40 | 114 | 162 | 685 | .088 | .058 |
| Patrick Wisdom | 9 | 61 | 25 | 92 | 149 | 534 | .098 | .047 |
| Rafael Devers | 9 | 56 | 27 | 110 | 156 | 614 | .082 | .044 |
| Rowdy Tellez | 8 | 52 | 35 | 91 | 149 | 599 | .088 | .058 |
| Jarred Kelenic | 7 | 45 | 7 | 88 | 149 | 181 | .080 | .039 |
| Adolis García | 7 | 45 | 27 | 106 | 156 | 657 | .066 | .041 |
| Ozzie Albies | 7 | 44 | 8 | 109 | 162 | 269 | .064 | .030 |
| Hunter Renfroe | 7 | 44 | 29 | 108 | 156 | 522 | .065 | .056 |
| Matt Olson | 7 | 44 | 34 | 119 | 162 | 699 | .059 | .049 |
| James Outman | 7 | 44 | 1 | 98 | 162 | 16 | .071 | .063 |
| Joey Gallo | 7 | 44 | 19 | 53 | 100 | 410 | .132 | .046 |
| Yandy Díaz | 7 | 44 | 9 | 108 | 150 | 558 | .065 | .016 |
| Brandon Lowe | 7 | 44 | 8 | 87 | 137 | 266 | .080 | .030 |
| Brent Rooker | 7 | 44 | 0 | 72 | 118 | 36 | .097 | .000 |
| Teoscar Hernández | 6 | 39 | 25 | 104 | 162 | 535 | .058 | .047 |
| Ryan Mountcastle | 6 | 39 | 22 | 111 | 162 | 609 | .054 | .036 |
| Yordan Alvarez | 6 | 39 | 37 | 90 | 130 | 561 | .067 | .066 |
| Nolan Gorman | 6 | 37 | 14 | 95 | 150 | 313 | .063 | .045 |
| Aaron Judge | 6 | 37 | 62 | 108 | 162 | 696 | .056 | .089 |
| Shohei Ohtani | 6 | 37 | 34 | 111 | 156 | 666 | .054 | .051 |
| Jake Burger | 6 | 37 | 8 | 59 | 112 | 183 | .102 | .044 |
| Sean Murphy | 6 | 37 | 18 | 94 | 137 | 612 | .064 | .029 |
| Shea Langeliers | 6 | 37 | 6 | 89 | 143 | 153 | .067 | .039 |
| Cody Bellinger | 5 | 34 | 19 | 92 | 142 | 550 | .054 | .035 |
| Yan Gomes | 5 | 34 | 8 | 61 | 101 | 293 | .082 | .027 |
| Mike Yastrzemski | 5 | 32 | 17 | 93 | 149 | 558 | .054 | .030 |
| Josh Jung | 5 | 32 | 5 | 96 | 149 | 102 | .052 | .049 |
| Julio Rodríguez | 5 | 32 | 28 | 116 | 162 | 560 | .043 | .050 |
| Marcus Semien | 5 | 32 | 26 | 115 | 162 | 724 | .043 | .036 |
| J.D. Davis | 5 | 32 | 12 | 84 | 143 | 365 | .060 | .033 |
| Kyle Tucker | 5 | 32 | 30 | 107 | 162 | 609 | .047 | .049 |
| Matt Chapman | 5 | 32 | 27 | 101 | 156 | 621 | .050 | .043 |
| Brian Anderson | 5 | 32 | 8 | 100 | 162 | 383 | .050 | .021 |
| Vladimir Guerrero Jr. | 5 | 32 | 32 | 113 | 162 | 706 | .044 | .045 |
| Bo Bichette | 5 | 32 | 24 | 113 | 162 | 697 | .044 | .034 |
| Austin Riley | 5 | 31 | 38 | 114 | 162 | 693 | .044 | .055 |
| Jorge Soler | 5 | 31 | 13 | 94 | 150 | 306 | .053 | .042 |
| Bryan Reynolds | 5 | 31 | 27 | 103 | 150 | 614 | .049 | .044 |
| Jazz Chisholm Jr. | 5 | 31 | 14 | 103 | 156 | 241 | .049 | .058 |
| Luis Robert Jr. | 5 | 31 | 12 | 108 | 156 | 401 | .046 | .030 |
| Brandon Drury | 5 | 31 | 28 | 90 | 150 | 568 | .056 | .049 |
| Vinnie Pasquantino | 5 | 31 | 10 | 106 | 162 | 298 | .047 | .034 |
| Mike Trout | 5 | 31 | 40 | 111 | 150 | 499 | .045 | .080 |
| Kyle Schwarber | 5 | 31 | 46 | 110 | 162 | 669 | .045 | .069 |
| Anthony Rizzo | 5 | 31 | 32 | 107 | 156 | 548 | .047 | .058 |
| Randy Arozarena | 5 | 31 | 20 | 111 | 156 | 645 | .045 | .031 |
| Chris Taylor | 5 | 31 | 10 | 62 | 118 | 454 | .081 | .022 |
| Andrew McCutchen | 5 | 31 | 17 | 97 | 143 | 580 | .052 | .029 |
| Harold Ramírez | 5 | 31 | 6 | 72 | 118 | 435 | .069 | .014 |
| Jack Suwinski | 5 | 31 | 19 | 73 | 118 | 372 | .068 | .051 |
| C.J. Cron | 5 | 31 | 29 | 90 | 137 | 632 | .056 | .046 |
| Luke Raley | 5 | 31 | 1 | 63 | 118 | 72 | .079 | .014 |
| Byron Buxton | 5 | 31 | 28 | 95 | 143 | 382 | .053 | .073 |
| Xander Bogaerts | 5 | 30 | 15 | 115 | 162 | 631 | .043 | .024 |
| Nick Maton | 4 | 27 | 5 | 85 | 155 | 85 | .047 | .059 |
| Jeimer Candelario | 4 | 27 | 13 | 108 | 162 | 467 | .037 | .028 |
| Kerry Carpenter | 4 | 27 | 6 | 75 | 135 | 113 | .053 | .053 |
| Austin Hays | 4 | 26 | 16 | 88 | 149 | 582 | .045 | .027 |
| Jonah Heim | 4 | 26 | 16 | 77 | 130 | 450 | .052 | .036 |
| Blake Sabol | 4 | 26 | 60 | 123 | .067 | |||
| Willy Adames | 4 | 26 | 31 | 109 | 162 | 617 | .037 | .050 |
| Jeremy Peña | 4 | 26 | 22 | 110 | 162 | 558 | .036 | .039 |
| Adley Rutschman | 4 | 26 | 13 | 116 | 162 | 470 | .034 | .028 |
| Jorge Mateo | 4 | 26 | 13 | 71 | 130 | 533 | .056 | .024 |
| Michael Conforto | 4 | 26 | 82 | 136 | .049 | |||
| Wilmer Flores | 4 | 26 | 19 | 80 | 136 | 602 | .050 | .032 |
| Thairo Estrada | 4 | 26 | 14 | 103 | 156 | 541 | .039 | .026 |
| Giancarlo Stanton | 4 | 25 | 31 | 54 | 81 | 452 | .074 | .069 |
| Bobby Witt Jr. | 4 | 25 | 20 | 109 | 162 | 632 | .037 | .032 |
| Ronald Acuña Jr. | 4 | 25 | 15 | 122 | 162 | 533 | .033 | .028 |
| Masataka Yoshida | 4 | 25 | 89 | 125 | .045 | |||
| Adam Duvall | 4 | 25 | 12 | 37 | 50 | 315 | .108 | .038 |
| Gleyber Torres | 4 | 25 | 24 | 101 | 156 | 572 | .040 | .042 |
| Tommy Edman | 4 | 25 | 13 | 91 | 150 | 630 | .044 | .021 |
| Freddie Freeman | 4 | 25 | 21 | 116 | 162 | 708 | .034 | .030 |
| Francisco Lindor | 4 | 25 | 26 | 115 | 162 | 706 | .035 | .037 |
| J.D. Martinez | 4 | 25 | 16 | 98 | 143 | 596 | .041 | .027 |
| Logan O’Hoppe | 4 | 25 | 0 | 59 | 100 | 16 | .068 | .000 |
| Brandon Marsh | 4 | 25 | 11 | 88 | 150 | 461 | .045 | .024 |
| Trayce Thompson | 4 | 25 | 13 | 48 | 106 | 255 | .083 | .051 |
| Michael A. Taylor | 4 | 25 | 9 | 85 | 150 | 456 | .047 | .020 |
| Wander Franco | 4 | 25 | 6 | 112 | 156 | 344 | .036 | .017 |
| Corbin Carroll | 4 | 25 | 4 | 99 | 162 | 115 | .040 | .035 |
| Ryan McMahon | 4 | 25 | 20 | 99 | 156 | 597 | .040 | .034 |
| Franchy Cordero | 4 | 25 | 8 | 52 | 106 | 275 | .077 | .029 |
| Christian Bethancourt 베탄코트 | 4 | 25 | 11 | 57 | 93 | 333 | .070 | .033 |
| Josh Lowe | 4 | 25 | 2 | 73 | 118 | 198 | .055 | .010 |
| Jesús Aguilar | 4 | 25 | 16 | 78 | 137 | 507 | .051 | .032 |
| Paul Goldschmidt | 4 | 25 | 35 | 113 | 156 | 651 | .035 | .054 |
| Juan Soto | 4 | 24 | 27 | 116 | 162 | 664 | .034 | .041 |
| Trent Grisham | 4 | 24 | 17 | 106 | 156 | 524 | .038 | .032 |
| Trey Mancini | 3 | 20 | 18 | 87 | 142 | 587 | .034 | .031 |
Max Muncy, LAD – Current: 11 HR, On Pace: 69 HR
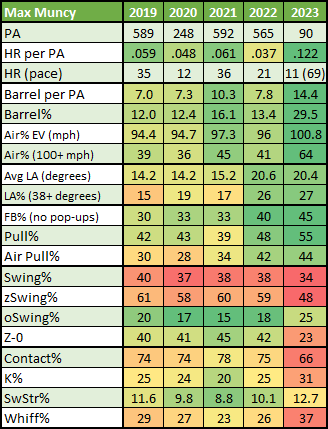
We might as well start at the top, with a literal Giants killer. After a cold week opening the season, only the birth of a child has been able to stop Muncy from hitting home runs, with the Dodgers second baseman hitting four home runs in four games before hitting the paternity list on April 24. He’s doing what you typically need to do hit bombs; hitting (and pulling) a ton of balls really hard and in the air. Easy-peasy, why doesn’t everyone just do that?
While we’d expect his (fairly outrageous) barrel rates and air exit velocities to come back to earth, it’s not like we haven’t seen Muncy finish in the upper percentiles before so I’m not banking on a complete utter crash of his home run rates. But we also can’t just pretend that Muncy will continue his home run pace while running swing (overall and in the zone) and contact rates that are some of the lowest in baseball, with whiff rates that are some of the highest. Time to get our toes wagging.
Max Muncy TOEWAG: 40 HR
I don’t think Muncy will suddenly stop hitting a lot of pulled fly balls with top-end exit velocities but he’s also prone to going ice-cold for stretches of time, something that might be exacerbated by combining even more passivity than usual with extra whiffs.
Predicting 40 HR (29 ROS) over 561 PA (projected according to 2023 games played and PAs per game) would put Muncy at .071 HR per PA for the year which would be his highest rate since 2014. But(!) don’t forget that the overall number would be weighted by the absolutely outrageous .122 HR/PA that he’s posted so far and my prediction of 40 HR would only put his rest-of-season pace at ~.060 HR/PA, a rate of power he’s very familiar with.
Patrick Wisdom, CHC – Current: 7 HR, On Pace: 45
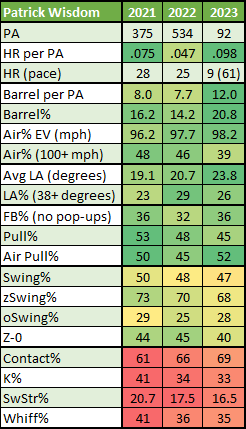
Like Muncy, Patrick Wisdom isn’t doing much different than what he’s shown previously when it comes to exit velocities and balls in the air, they’re just currently more extreme. However, he’s still the same big-time whiffer he’s always been, with a 33% K% that seems absolutely deserved given the 16.5% SwStr% and 35% Whiff%. But even with the buckets of whiffs that don’t seem to going anywhere, I don’t his home run rates are going anywhere far. Yes, his current rate of .098 HR/PA is unsustainable, and even his .075 HR/PA from 2021 would be asking a lot. But Wisdom is going to hit bombs at high rates, this much he’s shown us. The bigger question is whether that profile, with that many whiffs, will continue to play in 83% of games and wind up with >600 PA (on pace for 621 PA).
Patrick Wisdom TOEWAG: 36 HR
Wisdom’s home-run rate could be about halved (.05 HR/PA) for the rest of the season and he’d still end up with ~35 HR IF he were to garner the ~620 PA he’s currently tracking towards. But while I think <600 PA is still more likely than >600 PA, I also believe .050 HR/PA is further than he’ll drop. Let’s say that all balances out in the wash and Wisdom ends up with three dozen dongs.
Jarred Kelenic, SEA – Current: 7 HR, On Pace: 45 HR
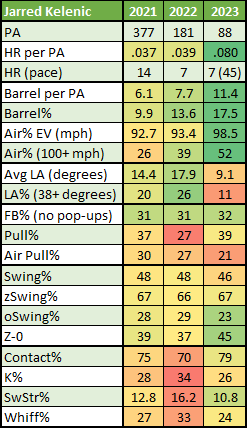
I feel like a there is certain subset of the fantasy community that just had a deep and lasting shiver run through their bodies after reading Jarred Kelenic, 45 HR. But while it may be too early to declare that Kelenic is officially the next, big thing, it is clear that the offseason adjustments to his swing and approach are paying big dividends.
Kelenic’s fly-ball rates are static even with a lot less uppercut in his swing but his Pull% is also way up, as are the levels of hard-hit balls (and barrels) in the air. But even with barrel rates and air EVs that rank in the upper tiers of power excellence, it’s the discipline and contact-rate improvements that are helping take him to the next level. Kelenic is chasing less, whiffing less, and making more contact, while absolutely smacking the taste off of baseballs. This is a solid combination.
Jarred Kelenic TOEWAG: 37 HR
Kelenic is only averaging 3.8 PA per game, as he’s stayed hitting in the bottom third of Seattle’s lineup. But even if he finishes with the 570 PA he’s pacing for, Kelenic could wind up with 26 HR and still post a .040 HR/PA just slightly better than his previous two seasons. However, I think he’s shown us with the results that his swing changes have wrought that he’s bucketing himself with a higher level of home-run rates than what he’s shown previously.
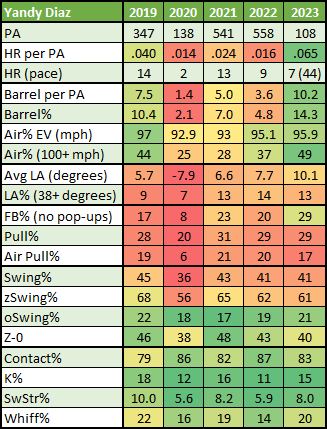
Yandy Díaz, TB – Current: 7 HR, On Pace: 44 HR
What packs two giant guns and has Stanton-esque home-run rates in 2023? This guy:
Yandy Díaz off Levi Stoudt
🔥 114.5 mph, 16°
Home Run 💣 (.803 xBA)#RaysUp pic.twitter.com/MMUc04S3zI— 💥MLB Barrels 💥 (@mlb_barrels) April 20, 2023
Now, maybe a home run laser beam hit at 16 degrees isn’t the best example but you know we’re talking about Yandy Díaz, right? As in the same Yandy that has famously been a worm-killer his whole career, regardless of biceps size, and who once averaged a -8 degree launch angle?
Well, that Yandy is currently tickling the fancies of we true believers with a career-high 10.1 degree average LA and 29% FB% that has helped lead to a .065 HR/PA that is career best by miles. Well, that and career highs in just about every EV metric you’d care to find.
Even with the large upticks in exit velocities, Díaz’s plate discipline is as elite as ever, as is his spot at the top of one of baseball’s best offenses. Given the batting average and Runs production, he already didn’t need to hit 20+ HR to be fantasy useful but if Díaz keeps up even a shadow of his current power rate, he could wind up as a top-50 fantasy hitter. Case in point; did you know that he’s currently #10 on the Razzball player rater? Not among third baseman – overall.
Yandy Díaz TOEWAG: 29 HR
Díaz could only run around the .040 HR/PA that was his previous best and still end up with ~25 HR for the year given he’s pacing for near 680 PA. Compiling is a beautiful thing and Díaz has one of the best spots in fantasy for doing so. But I’m an optimist (and known Yandy honk) so I’ll toewag on the bright side with 29 HR. That might sound like a lot for someone with a total of 22 HR in his past two seasons but 29 HR would only put him at a .040 HR/PA for the year, a mark that those exit velocities say should be more than attainable as long as he continues getting it up in the air more.
Wander Franco, TB – Current: 4 HR, On Pace: 25 HR
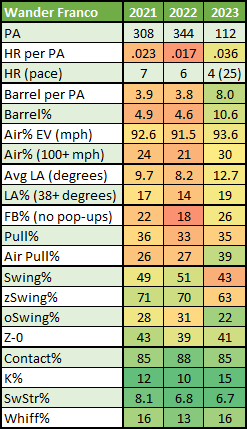
Much of the fantasy discourse on this Wander Franco can basically be boiled down to three words – “but the power”. Uber prospect with an elite hit tool?…But the power. Does everything well and plays for one of baseball’s best organizations?… But the power. Has one father and two brothers with the same name?…But the power.
Franco could be as well-rounded and slick-hitting as anyone in baseball but without even a modicum of power, he’s still just a fancier Luis Arraez for fantasy purposes. Which is fine! But also not worthy of a top-75 pick. But while pacing for 25 HR might not sound very exciting, it very much is given the rest of Franco’s skillset, with lineup context that sets him up for piles of PAs and R/RBI opportunities. He might have only 4 HR but with 15 R, 14 RBI, 5 SB, and a .304 AVG, Franco is currently ranked #28 on the Razzball player rater.
Wander Franco TOEWAG: 25 HR
Looks like I’m tracking the pace car, as a 25 HR total and a rate around .035 HR/PA doesn’t seem too onerous given his above-average EVs combined with the amount of PAs he should continue to compile. And “compile”, is the key; you don’t need as outrageous of power metrics when you’re looking at getting >675 PAs on what is currently an offensive juggernaut.
Brandon Lowe, TB – Current: 7 HR, On Pace: 44 HR
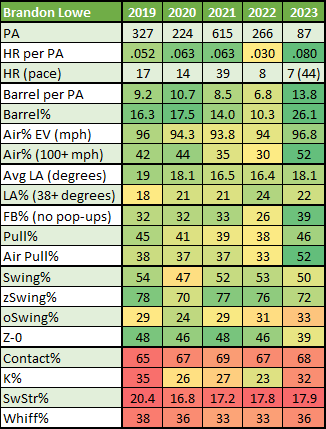
Okay, we might as well close out the Tampa Bay Rays category, and gush over analyze one of my most-rostered players in 2023. But actually, I don’t think we need to much analyzing, let alone going overboard on picking statistical nits; Brandon Lowe is basically doing in 2023 what he’s always done, save for a back-injury riddled season last year. Sure, the numbers have been supercharged in this early small sample but Lowe is just doing what he does; hitting a lot of balls in the air at alarming exit velocities while collecting a whole mess of home runs. Does he whiff? Damn straight. Does it matter? Not so much.
Brandon Lowe TOEWAG: 39 HR
Does anyone care to wager that Lowe will finish 2023 with a home run rate that’s markedly less than the .060 – .065 HR/PA zone? Yeah, me neither. His power rates may cool their jets some but I think his home run total will only be checked by the plate appearances that will again be limited depending on how many left-handers Tampa Bay sees, with Lowe having started against only one of the seven LHP that the Rays have faced. Finishing with more than 600 PA might be too much to ask but even at 39 HR in 600 PA would put him at a .065 PA HR/PA that’s well within his grasp given what we’ve seen the uninjured version do previously.
Trent Grisham, SD – Current: 4 HR, On Pace: 24 HR
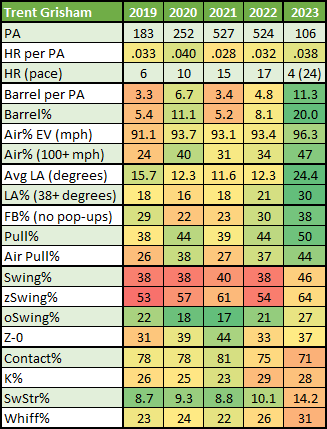
Trent Grisham’s value has taken a hit since the return of Fernando Tatis Jr., as his “leading off vs RHP” stock is now on the blocks. And it’s not like anything jumps out about his home run rates, as a .038 HR/PA in 2023 is right in the same range as it’s been before. But I would just like to put a quick small-sample spotlight on the EVs and batted-ball metrics that have started off very, very different than what we’ve seen pretty consistently before. Grisham’s barrel rates have more than doubled, his Air% EV has risen 3 mph, big jumps in launch angles (both on average and ones that were +38 degrees) have led to a career-high FB%, while he’s also pulling the ball more than ever.
Trent Grisham TOEWAG: 21 HR
This might not be some sort of lurking power outbreak but I think we should at least be paying attention when any player turns in dramatically different results on metrics that often portend a power boom. Just something to keep an eye on.
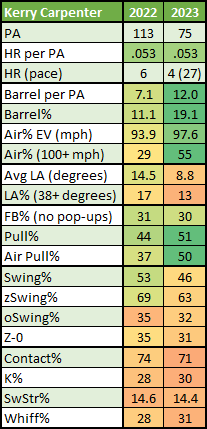
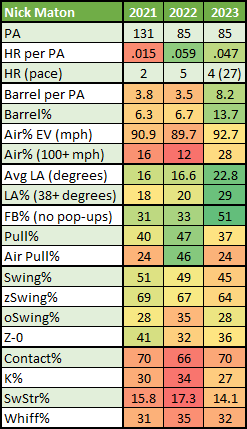
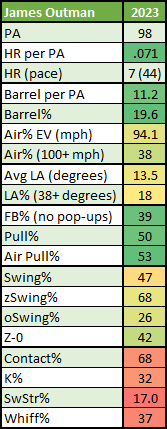
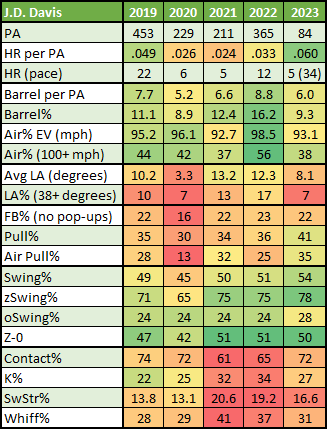
Just the Pics – Discuss Amongt Yourself
Kerry Carpenter, DET – Current: 4 HR, On Pace: 27 HR
Nick Maton, DET – Current: 4 HR, On Pace: 27 HR
James Outman, LAD – Current: 7 HR, On Pace: 44 HR
J.D. Davis, SF – Current: 5 HR, On Pace: 32 HR
this is awesome and i am so sorry to gripe but: bellinger has 7 homers, yet this chart presupposes he has 5?
Looks like Nick pulled data through 4/27 for this piece.