Position Scarcity in FanGraphs Points Leagues
Commenters in my last post asked how to determine position scarcity in FanGraphs Points leagues, and another reader, Kris, suggested using box plots. I figured “hey, that’s a good idea for a post.” So, here is a box plot based on Marcel projected 2011 performances for starters at each hitting position (using the numbers of players per position that Zach used here).

If you haven’t seen these graphs before, here’s a good description of how they work. But very briefly: the “box” is the middle 50% of the data, and the whiskers show the range of values outside of the box…unless there are outliers, which are then ignored for the whiskers and plotted as individual points. The black horizontal line inside the box is the median, while the dotted line is the mean.
You can get tons of information out of one of these plots. Beyond simply the rank order (which is clear), a quick look at the size of the boxes gives you a good indication of the amount of variation in the bulk of players at a position. You can see that there’s a lot of variation among catchers and first basemen, while there’s less among the shortstops (with two exceptions, mentioned below).
You can also get an idea about the shape of the distributions. One thing you see across the board is that the positions all tend to be a bit skewed: there are lots of players close to replacement, with gaps between players getting larger as you move toward higher projected Points per PA. This is particularly dramatic at SS and 3B, where you have a handful of elite players that pull the mean up, despite the fact that the median guy you get at these positions is much lower. At SS, the elite duo of Hanley and Tulo are perched massively above the rest.
All of this has implications if you’re trying to come up with a number for a position adjustment. Say, for example, you base it on the mean FP/PA. By that measure, you’d think that 3B is the second-best position, behind only 1B’s. If you use the median, however, you’ll rank them below OF’s as well, and only slightly above the 2B/3B territory. Shortstops rank last by both measures, but the awfulness of SS is much worse by the median compared to mean measures. Catchers are interesting–they rank reasonably well this year compared to 2B/SS. But they play far less than other positions, which gives an extra premium to the guys who actually play 5-6 games per week instead of 3-4.
We can just plot total projected points instead of points per PA to see how PT affects positions. Here’s that graph:
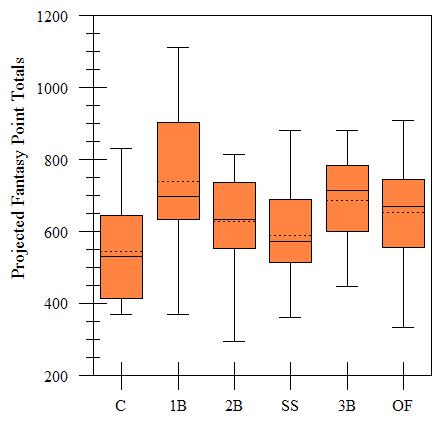
Note that this is based on Marcel PT projections, which are far from perfect and are strictly based on past MLB usage. But you can see that individual catchers projected to score far fewer points than players at other positions, simply because the typical catcher plays in fewer games than other positions. Of course, since ottoneu uses two catchers (with a combined cap of 162 games), this problem is mitigated to at least some degree…as long as you get good performances from your backup catcher (so don’t neglect him!).
What else do you see when you look at these graphs?
Justin is a lifelong Reds fan, and first played fantasy baseball on Prodigy with a 2400 baud modem. His favorite Excel function is the vlookup(). You can find him on twitter @jinazreds, even though he no longer lives in AZ.
3B is way denser and top heavy than a high pick of Longoria would justify based on scarcity.
Of course 3PA is the best indicator to see how well a guy played last year, but all leagues are won by the guys that get the most PAs with the highest quality so durability and lineup spot are more important than any other factor – scarcity included.
I don’t know what you mean by 3PA.
As for most PA’s…it depends on your league. In a H2H league, I think this can be very important. But in an ottoneu league, where games are capped, while I can see lineup spot mattering a bit, I think durability is less important because you can use off days throughout the season to make up for lost games pretty easily.
So generally speaking, do I want to draft a position early when the average is far above the median?
And I can afford to draft a position late where the median is above the average, because there is less of a gap between the top player and the median player? Do I have that right?
If you want to play that game, I think you’re generally correct. If the median is above the mean (I’m compelled to be a dork and state that both the mean and median are both “averages”), that means that the middle-ranking team is going to get a player who is above the mean in production…you just want to be sure you don’t end up with one of the guys pulling down the mean!
In a position like SS, however, where there are essentially two elite guys and then everyone else, you may want to be aggressive at first and then just wait until the late rounds since there’s not much difference between the best non-Hanley/Tulo player and replacement level.
I personally prefer to just set scarcity based on replacement level at each position. That way, my ranks are based on points above the worst player at each position. I’m sure that there are some problems that people could raise with it, but it does a nice job of automatically makingthe sort of decision making I was just describing with SS’s.
Looking at the box plot, though,the way I do it probably does underestimate the value of elite 3B’s. I’ll have to think more on it.
-j
What, or who, causes the relative position of the median and mean to change so drastically for third basemen and, to a lesser extent, outfielders? Does this mean there are a number of 3Bs who are bad but will not see much playing time? And if so, would they be rostered in a normal sized league? If so, perhaps the information from the total points, rather that points per PA, is more useful.
I tried to only choose players here that are slated to be starters here. That said, in some cases, Marcel forecasts fairly low PA’s for those players because they previously haven’t gotten much PT.
Generally speaking, because we can replace missed games fairly easily, my belief is that something in between total points and points per PA is the best measure of player value. It’s sort of line the difference between runs created and wOBA–neither gives the right balance between playing time and productivity. I essentially use something that works a lot like oWAR at BRef, and it seems to work well.
-j
I do the same thing in looking at scarcity and also look at the standard deviation. The two things I look at are whether the mean or median is higher. Where mean is higher, I know I want to be in the top tier of that position. The higher the mean relatively to the median, the more I want to be there. I’m definitely taking a top 6 1st baseman in every league this year. Where the median is higher, I’m in the lower tier. I’m taking a lot of Casey McGehee and Aramis Ramirez at 3rd base for instance. Where the mean and the median are close, I tend to ignore scarcity all together and figure there’s a pretty smooth distribution, with players in the mid tier being pretty fungible (stdev is a guideline there as well).
I also tend to throw out scarcity for catchers and shortstops as well because I think the outliers get disproportionaltely overvalued so I don’t get a crack at them (because I tend to think that raw value trumps adjusted scarcity value early in the draft). Once you throw out Mauer, Tulo and Hanley, you get a much smoother distribution and they behave a lot like 2nd base. That said, I like Hanley to closer to his top end projections this year and I would probably draft him #2, though I haven’t had that pick yet.
Yah, I love box-plots hard. The first thing I go for is the size of the box (or 50% of the players) and then the size of the boxes above and below the mean (25% each). I figure at the beginning and end of the draft, scarcity isn’t my first focus. I just draft guys that I really dig.
Catcher is wildly interesting this year, especially when you adjust your player pool down to the 16 or so catchers that’ll get drafted.
This graph is really helpful. Obv shows the value of Pujols/Hanley/Tulo but also check out the 2B plot in the 2nd graph. Grab someone in the Phillips-Weeks range rather than wait for Beckham/Figgins/Kendrick range, no?