MLB Draft Data: Part Two
Last week, I introduced some data on the MLB Amateur draft, and focused on some trends throughout the entire draft. I looked at the value of different rounds and compared the value of different years as well. For this week, I am going to focus on players drafted in the first round using draft data from Baseball Reference. I chose to isolate the first round since that’s where we tend to see the most successful players on average and will also help eliminate most of the players who were drafted twice, even though there will still be some players who were drafted twice in the first round. This data also includes players who were drafted, but never made it to the majors. Without further ado, let’s dive right in.
First portion of graphs will look at where players have been drafted from to see if any schools stand out as being better than others at developing first round talent. This first graph shows how many players were drafted in the first round per university or college, focusing on schools that produced a minimum of 13 players. No reason for that number other than this amount seemed to fit nicely.
Reminder: in order to see specific players from a specific school, click on the bar you want to look at. Then click on the list icon on the right side. That will open a new window where you can then select Full Data. That will give you a list of players taken from a particular school.
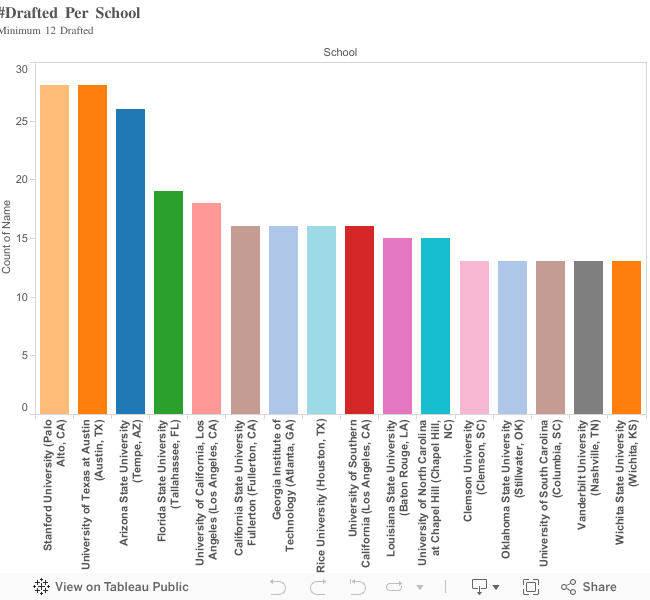
On this graph, there are 16 teams. Four of them, or a quarter of them, are from California, and two of them are from Texas and South Carolina. There are 278 players on this graph, and 28% come from California schools. Not too surprising, though I expected a better showing from Texas and Florida schools, but this graph does not capture the entire pool of players, so that might not be fair to take too much from this. The biggest surprise for me was seeing Wichita State produced 13 first rounders, with Joe Carter leading the way with a WAR of 19.3.
I then wanted to see which schools produced the highest quality players, so the next graph shows the same 16 schools ranked by Total WAR from the first round.
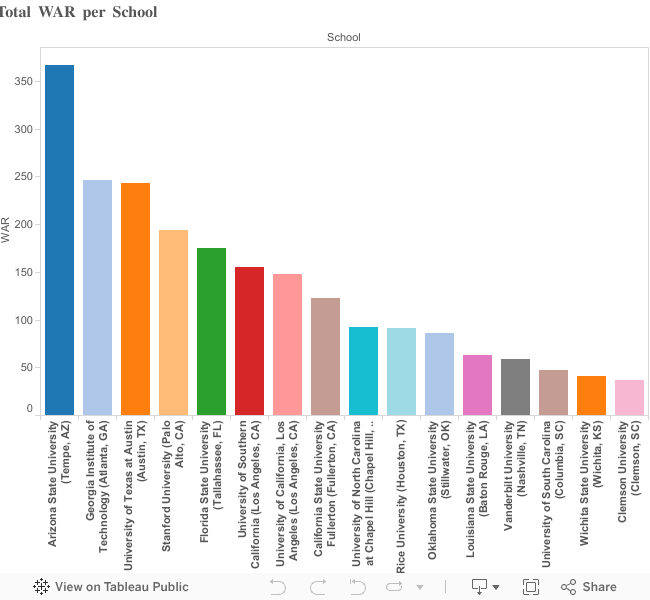
So Barry Bonds (once again) crushes our data with his 162.4 WAR. Combine that with Reggie Jackson’s 73.8 and you have Arizona State at the top of the total WAR rankings in the first round. Rick Monday and Floyd Bannister come in third and fourth respectively, making Arizona State the place to be (at one point). The last first rounder from Arizona State was Seth Blair in 2010.
Texas is also a bit top heavy with Roger Clemens, followed by Greg Swindell and Huston Street. They have had some presence in the 21st century with ten first rounders during that time. The biggest surprise (for me at least) was the strong showing from Georgia Tech. Granted, Jason Varitek shows up twice skewing the data a bit, but Kevin Brown, Mark Teixeira, Nomar Garciaparra, and Jason Varitek is a nice top four.
Next, let’s see which if certain schools are better are producing better pitchers or hitters.
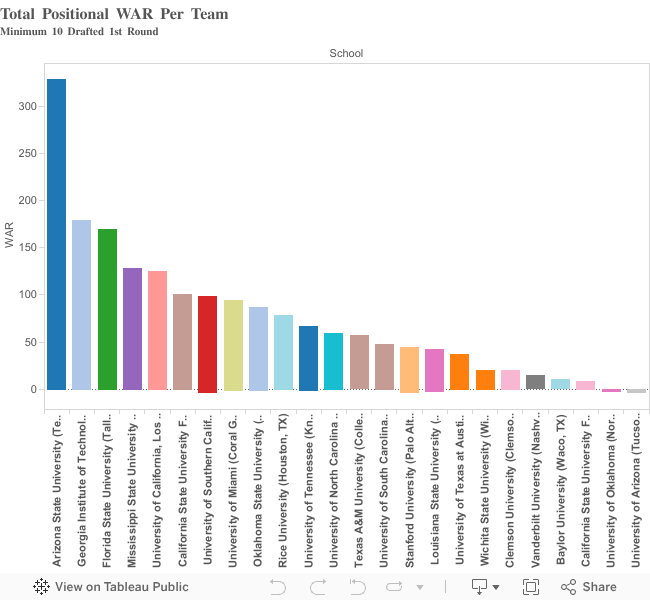

You can see the data for yourself. What is most interesting about these graphs is right clicking and looking at the specific data to see who came from where. The drop off for pitchers also seems more dramatic as even the so-called pitcher factories have not produced that many first round picks who became stars. The rest of the schools have a few mid-level pitchers or one pitcher who skews the data, as the rest of their pitchers did not fare so well.
Next, I wanted to see if there was a positional distribution of picks based on whether they came from a 4 year college or high school in the first round. Here is the graph to show the distribution:
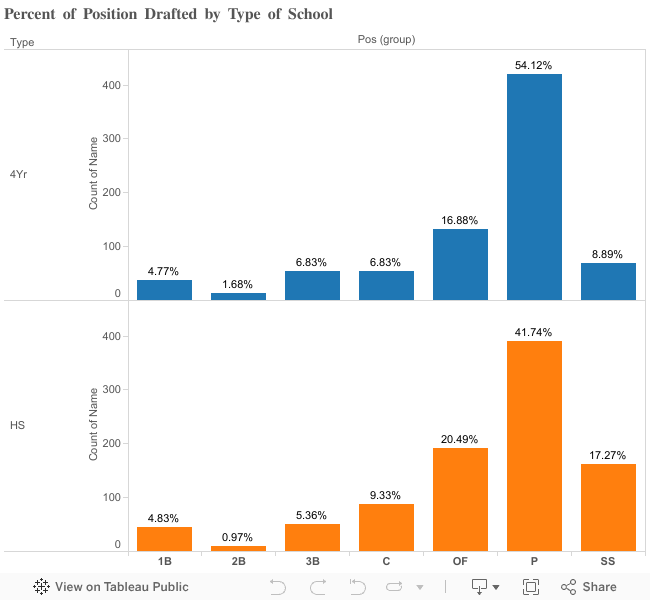
The distribution of first baseman, second baseman, and third baseman is rather close. The low amount of second baseman stands out. My guess is that most players who become good professional second baseman were probably shortstops at the lower levels, and were eventually converted. I also think that players who are really good second baseman in college and high school may not be deemed valuable enough to use a first round pick on. In this data, only 22 second baseman total were taken in the first round.
Over half of the college players taken were pitchers. For high schoolers, there were more outfielders, shortstops and catchers. I could go on about all the potential reasons, but the reality is I am not sure why this is. The only strong guess I have is that pitchers tend to develop later, as younger pitchers are bigger risk for the first round and teams want to see them develop further before taking them so high.
Next week I will explore the drafting data per team and look at how each team has performed over the years.
I’m a ramblin wreck from georgia tech, and helluva baseball player!