MLB Draft Data: Part Three
Last week, I mainly focused on first round picks and where the most players are being drafted from, as well as some positional distribution. I had mentioned focusing on individual MLB teams and how they have drafted in this concluding article. To start, however, is a map of where first round picks are coming from and what value they have had. This map does not represent the hometowns of first round picks. The map shows the location of a school where a player came from.
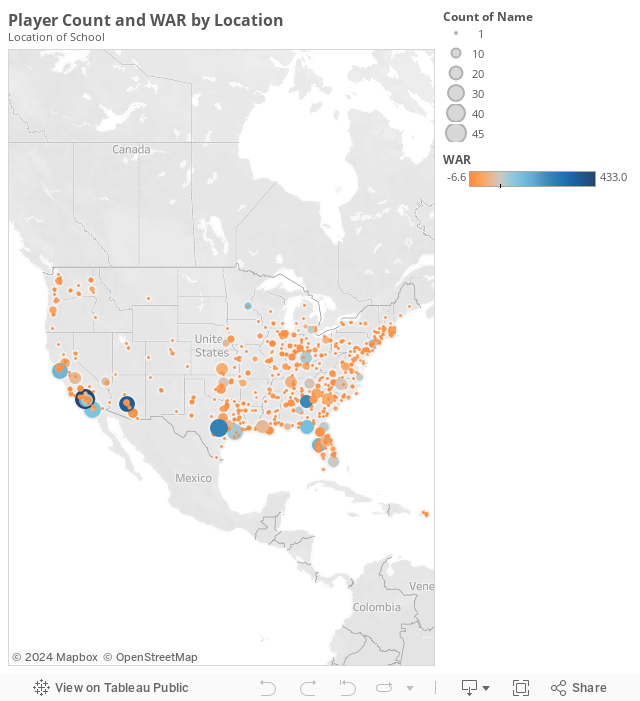
The larger the circle means that there were more players drafted from that area, and the darker blue means that particular city produced more WAR than others. I set the center line at 100, so cities that are blue produced over players with a total WAR over 100, and cities that are orange produced players with a total WAR under 100.
Generally speaking, the larger circles represent colleges in that city that produced a proportionally larger amount of players than other cities. I was hoping to get some cities to stand out with a lot of high school players, but not so much. I will show a graph further down with some of the top high schools at producing first round picks.
Not surprisingly, Texas, California, and Florida seem to have produced the most quality talent compared to other states. The University of Minnesota did not have a lot of first rounders come from their school, but Dave Winfield and Paul Molitor are two excellent Golden Gophers, making the Minneapolis circle small but blue. The same goes for Seton Hall who produced Craig Biggio and Mo Vaughn, giving South Orange, NJ a rare blue circle in the northeast. I had a lot of fun exploring the map and finding various outliers and learning where some famous (and some not-so famous) ballplayers came from. Or at least went to school. Hopefully you will enjoy this map as much as I did.
I then wanted to see if any high schools stood out as powerhouse schools where first round picks come from. I also color coded this by state to see if any states stood out, and limited the list to schools with three first round picks. Here is what you get:
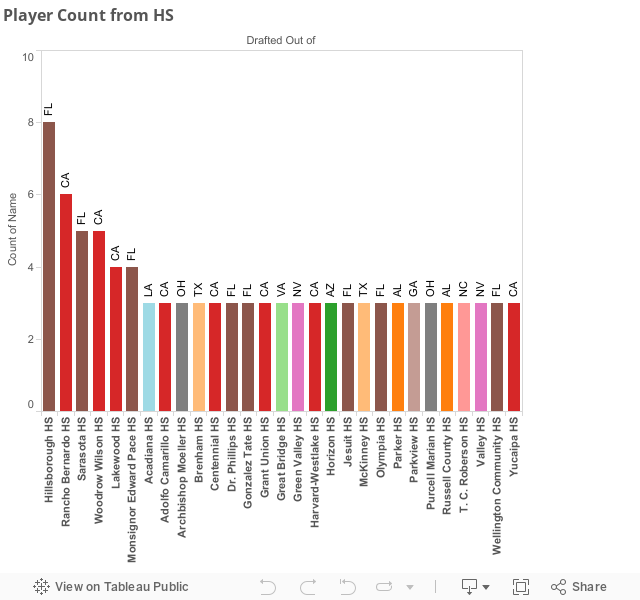
Hillsborough High School in Tampa stands out with eight first round draft picks. Three of them became extremely talented pros: Dwight Gooden, Gary Sheffield, and Carl Everett. Interestingly, all had various demons to combat, even though Sheffield’s supposed demon may have actually helped him. Either way, imagine if Everett and Gooden had lived up to their full potential as Sheffield did. That would be some trio to have graduated. Although Rancho Bernardo High School has produced the second most first round picks, only one player (Cole Hamels) has actually made the pros.
There are 29 schools on this particular list. 15 of them are located in Florida and California, and only two from Texas. Thought Texas may have a better showing, but there wealth is a little more spread out. Something else I found out: there were 904 high schoolers drafted in the first round. 215 of them are from California, whereas 116 were from Florida, and 92 from Texas. California clearly dominates the first round high school game, at least in volume.
The rest of this article will focus on the performances of teams in the draft, specifically in the first round. Since some players were taken multiple times, I wanted to avoid figuring out how to value those double-dippers. There are still some players who were taken more than once in the first round, but this data is still a little cleaner.
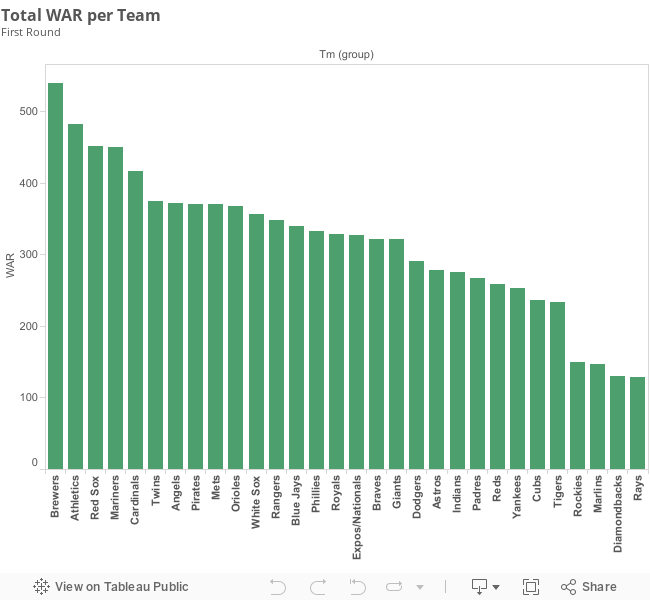
So the Brewers come out on top in terms of Total WAR drafted in the first round. If you inspect closer, it is a very solid list. There are no players with a WAR over 100 to skew the data. It is just a nice balanced list that leads the way with Robin Yount, Paul Molitor, and Gary Sheffield. Ryan Braun and Prince Fielder will continue to increase that number, as will other younger more recent first rounders (then again, I guess that can be said for every team).
This graph is unfair to recent expansion teams who have not had the opportunity to draft a lot of players. So let’s see who was most efficient with their picks by looking at Average WAR per Team, which will find the average of all players taken by a team in the first round.
The Brewers are still at the top of the list, but the Rays moved up significantly. The Mariners are also up there again, but that is what happens when you draft Alex Rodriguez and Ken Griffey Jr. Nobody after those two players exceeded 30 WAR.
Honestly, I was hoping that this data would show some sort of correlation between teams that win and drafting better in the first round, but there are just so many variables and players that contribute to a winning team that the first round is just a blip on the radar. Admittedly, if I isolated the data for players who drafted and signed, there may be a stronger correlation, but I am still skeptical. Some teams keep their prospects, while others trade them. Some teams opt to sign multiple free agents, while others let their expensive players go and in today’s market, collect more draft picks. There is no singular way to win, and I don’t think this article makes that more or less clearer.
To conclude these draft visuals, I hope you were able to explore and have some fun with them. I don’t think I came across any striking conclusions, except that earlier picks on average are so much valuable than later draft picks, but that is no surprise. With that said, it’s not as if every top 5 pick is a superstar. There are a lot more misses than hits, but when a team does hit, it seems like the whole process is worth it. Teams do seem to be getting better, yet I would still argue there is so much more value in a known commodity then a high draft pick for the most part.
Great job with this. I knew when I saw how high the Mariners moved up in that second team graph that it would be mainly A-Rod and Griffey. The teams more recent 1st round picks have been brutal.
That map… so amazing.