Keep, Cut, Start
It’s getting late in the fantasy season and endgame strategies are starting to come into play. While it is possible to guide your offense toward specific categories, a greater impact can be made with how you direct your pitching, depending on which categories you are looking to massage, and so that’s where we’ll continue to focus.
If you haven’t yet, I’d recommend checking out our fearless leader’s recent article on making sharp decisions to help map out which categories you can make headway in and which path will give you the best chance for the most points. A strategy that needs to chase wins/strikeouts will be far different than one that is solid on counting stats and looking to make gains in ratios. And depending on your path forward, not only will every start decision come with a much different level for qualification, but who deserves to stay on your roster can also swing wildly from what it’s been all season.
Not only might you need to sit stud starters in favor of lesser players that better fit your goals but you may face some brutal cuts, to make room for players more suited to your best path forward. And as you get closer to the end line, your ax should only get that much keener.
Let’s use a real-life example:
I’m in a 12-team OC on NFBC and am currently in 4th place, seven points out of first. But the top-4 has been pretty fluid and I was within three points just a few days ago. Led by Justin Verlander, Dylan Cease, and Josh Hader (RIP Taylor Rogers) pitching has been a strength but after doing a recent categorical autopsy, the path to the most points has come clearer:
- I’m leading strikeouts with cushion (2nd is 20 back, 3rd is 50 back) enough that I’m unlikely to fall back much.
- About the same on wins, though I’m in second – three behind first but seven in front of third.
- Similar on saves – in third and could catch second (one behind) but am unlikely to catch first place.
Not only is there little room for upward mobility in the three counting stats but where I’m positioned (along with confidence in my three top guys) makes me fairly secure in not falling back too much. However, there is plenty of room to be made up in the ratios, as I’m fifth in ERA and 8th in WHIP, making this a situation ripe for moving to an RP-heavy strategy – and in a 12-team league, there are plenty of solid non-closing options to help me. But as the rest of my starting staff is fairly strong, this strategy will require some difficult sits and/or cuts.
Assuming three of nine starting slots go to Verlander, Cease, and Hader, that leaves six spots for Spencer Strider, Ranger Suárez, Joe Ryan, Luis Garcia, Drew Rasmussen, Patrick Sandoval, Nick Pivetta, James Kaprielian, Braxton Garrett, Justin Steele, and Roansy Contreras. In a 12-team league, some of those are already easy cuts but it’s also not six spots available, it’s six spots minus however many relievers I want to use.
Let’s say I jettison Pivetta, Kaprielian, and Steele (who, ICYMI, has a 1.67 ERA over his past eight starts ; ) in favor of three (for now) RPs. That leaves just three starting spots for Strider, Suarez, Ryan, Garcia, Rasmussen, Sandoval, and Garrett. Not only will my start decisions be much tougher going forward but the chopping block may also need to cometh quickly if I need more RPs and/or have to cover any hitter injuries. Simply put, pitchers I really like and have been very useful this season, might start hitting the block.
This is one example but I also have two other leagues where the situation is fairly similar, in that the most ground I can make up is in ratios (and Saves) and I’m going to have to (or already have) make some tough cuts. This is what led me to this week’s article, as I’ve been diving into pitching values, trying to see who’s done what for me lately and comparing that recent value to what they’ve returned previously.
Using a basic z-score method, I calculated starting pitcher dollar values for three time periods, using April – June as the first one, July – Current as the second, and season-long as the third. I’m not saying the values are world-beaters but am confident they’re going to be in the ballpark of most reputable makers of fantasy baseball bucks, as the method is simple and proven.
We’re not trying to reinvent the wheel here, just get to a space where we know around how much total value a pitcher has carried, taking into account all of the scored fantasy categories. And really, any time you use arbitrary endpoints when calculating values, results are going to be greatly determined by which point you choose. Especially for pitchers! Add or subtract just one full day of starter results and things will swing wildly. Not only could particular pitchers have really good or bad starts that affect their own value but since values are relative to the total pool, pitchers who don’t pitch on a day lose value simply through the attrition of those that do.
Plus, values won’t tell the full story of how much a pitcher has been “worth” simply because you might not have started them every time. That means there are a lot of tweener starters (and starts at Coors) that might not have their true value reflected in a total valuation.
This is why I’m happy to just get close for the purposes of our discussion. Changes in value aren’t the answer we’re looking for, just a guide stone. A way to see who has been contributing, and how. Does it matter that Justin Verlander (#1 overall) was ranked 2nd in the first period but only 13th in the second period? Not really. Considering there are no warning signs in the underlying numbers in his ratios/strikeout rate and no reason to doubt that his likelihood to earn wins is the same, we can probably chalk up the variation in his rank to normal performance fluctuations and the aforementioned arbitrary endpoints
But what about Shane McClanahan (#3 overall), who was ranked first in the first period but has fallen to 37th in the second period? That is a drop of a lot more than a handful but a little digging makes me think it’s more about circumstance than talent. To see why (and to warm up for later), let’s go by category:
- Wins: Win totals in a small sample can wreak a lot of havoc on values and McClanahan dropped from eight wins (t-3rd) in the first period to three wins (t-31st) in the second period. But considering that the Rays’ offense/bullpen still looks basically the same and McClanahan has stayed steady at 6.1 IP per start, I’m saying his chances of picking up wins will stay roughly the same.
- Strikeouts: Dropping from a 35.7% K% to 25.1% K% is no small dip, with McClanahan going from the strikeout leader (123 K) to sitting just above average at 42 K (53rd). But while his actual strikeout rate took a beating, the underlying metrics didn’t. His 16.7% SwSt% in the first period has been at 16.5% in the second period, and a 35.2% Chase% has actually increased to 36.6%. Sugar Shane had and still has bunches of whiffs – the punchies will be back.
- WHIP: Going from totally ridiculous (0.83 WHIP) to slightly less ridiculous (0.95 WHIP) probably shouldn’t be held against him. The walk rate, while up a point, is still elite, and a .253 BABIP in the first is just like a .252 BABIP in the second. I’ll bet those BABIPs are fueled more by difficulties with handling his pitches than by luck and will assume that McClanahan will continue to run a top-tier number.
- ERA: Believe it, or not, a 1.77 ERA generally isn’t sustainable over a full season (unless you’re Jacob deGrom, of course) so McClanahan coming back to earth (3.35 ERA) shouldn’t be a shocker. But the FIPs from both periods stayed in the same range (2.55 FIP vs 2.84 FIP) and his home run rate dropped significantly (1.1 HR/9 to 0.6 HR/9). Again, I’m happy to bet the ERA dip was more about sample variance than any sort of skill change.
When you break things down like the above, McClanahan dropping from SP1 to SP37 doesn’t seem like that big of a deal. And looking at the inverse, that is pitchers who’ve increased their value significantly, we can look at things the same way. Is the rise in value driven by the more unpredictable wins, a strikeout rate increase that wasn’t backed by an increase in the underlying metrics, or ratios that seem like a FIP-bomb waiting to happen? Look at things in pieces and we have a better chance of finding out.
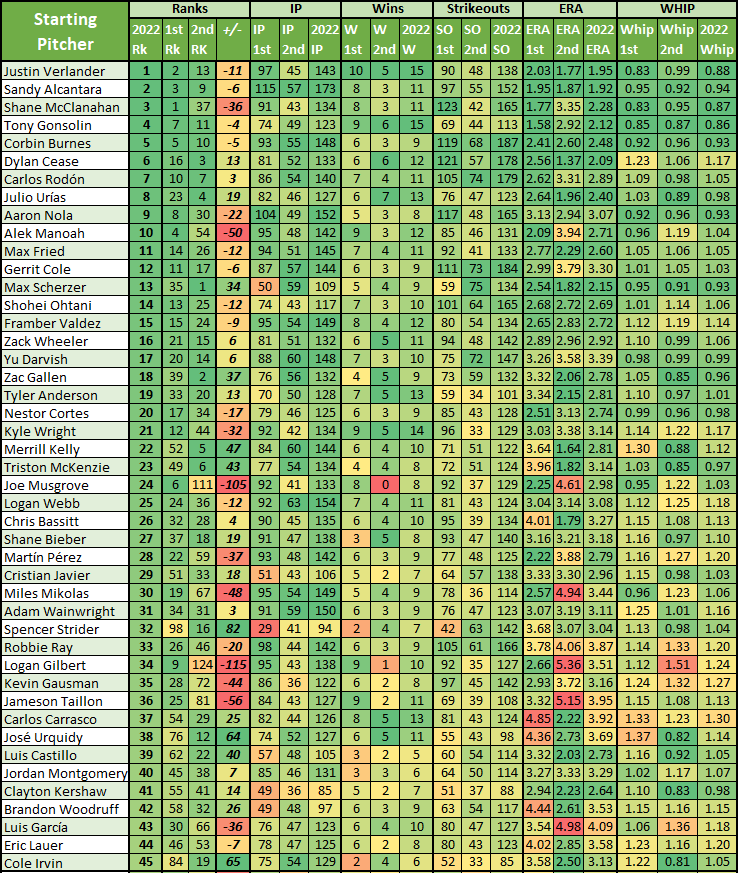
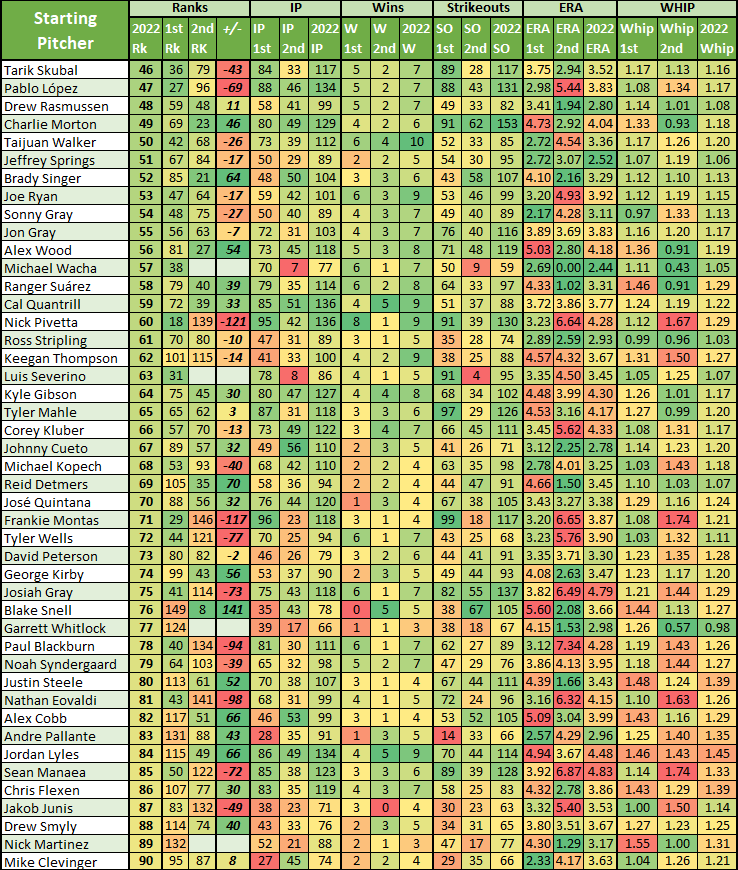
With that in mind, let’s look at who has increased and decreased their values the most and see where there might be landmines. Below are the top-90 pitchers in overall value for 2022, and for our two listed time periods, along with their classic roto rates. These charts won’t provide the full answers for who to keep, cut, or start, but hopefully looking at how and where different fantasy contributions have come from will help you make a more informed decision.
After the jump, we’ll take a closer look at four starters whose value ranks have plummeted lately but if you want to do some spitballing on any other tough decisions you have, please feel free to hit me up in the comments.
Joe Musgrove, SD, SP 24 overall (1st: SP 6, 2nd: SP 111)
With zero wins in our second period, it’s easy to point a finger for the value suck. Wins are a fickle beast but Musgrove also has a couple of stinkers mixed in, running a 4.61 ERA over seven starts. But is he actually struggling overall or just against Colorado? In two starts against the Rockies (one at Coors), Musgrove allowed 11 ER over 9.2 IP; in his other five starts, he allowed a total of 10 ER over 31.1 IP. And while the strikeouts have also dipped (25.6% K% to 21.3% K%), his SwStr% is only down a half of a point and his chase rate has stayed steady.
Verdict: Keep starting
This feels like a big, old variance-driven nothing burger. Carry on and hope he starts catching some wins again.
Logan Gilbert, SEA, SP 34 overall (1st: SP 9, 2nd: SP 124)
This one feels even simpler than Musgrove. Gilbert’s ratios have blown up, his strikeout rate has dipped six points, and he’s picked up just one win in eight starts. But his SwStr% has only dropped slightly, his walk rate is only up slightly, and his BABIP in the second period is fifty points higher than in the first.
But what really happened is that the schedule has been a real hammer lately – and Gilbert’s been the nail. In his last eight starts, he’s faced the Yankees, Astros, and Rangers twice each, with the other two coming against Toronto and San Diego. That is simply brutal. But really, it was only the Yankees that absolutely did him in, pasting him with a total of 13 ER over 9.1 IP. In his other six starts, he also allowed 13 ER but over 34.1 IP.
Verdict: Keep starting
Not only does Seattle not play the Yankees again in the regular season, but the Mariners also have a prime-time schedule for fantasy success going down the stretch. They have upcoming series with Oakland and Detroit but their last six series of the season are against:
Los Angeles Angels: 4 games
Oakland: 6 games
Kansas City: 3 games
Detroit: 4 games
If you’re keeping track at home, that’s 17 games in a row (and 3-4 turns through the rotation) against literally the worst teams in baseball. Juicy, juicy, juicy.
Nathan Eovaldi, BOS, SP 81 (1st: SP 43, 2nd: SP 141)
How about another easy one? Because while we can point to a bevy of ugly changes in Eovaldi’s results, the story can pretty much be told by the following:
Prior to going on IL: 68.1 IP – 3.16 ERA – 1.10 WHIP – 25.8% K%
Since return from IL: 31.1 IP – 6.32 ERA – 1.63 WHIP – 16.7% K%
Verdict: Cut as soon as necessary
Considering he just went back on the IL*, this now seems more obvious. But even before he hit the list again, I had him as a cut (and have already done so). Eovaldi simply never got back to the pitcher he was before his back injury, with velocities that significantly dipped across his pitch mix and results that fell into the basement.
*Edit* – Apparently, I just fever-dreamed this, as Eovaldi has not gone back on the IL…Yet?
Nick Pivetta, BOS, SP 60 (1st: SP 18, 2nd: SP 139)
He’s coming off of his best start in nearly a month but I’m only giving him half credit since it came against the Pirates. And because prior to those seven shutout innings (1 H, 6 K, 3 BB) in Pittsburgh, the Pivetta train had been leaking oil for a while, sputtering and puttering down the track. Even including the great Pittsburgh start, Pivetta has a 6.64 ERA, 1.67 WHIP, and 20.4% K% since July 1.
His strikeout rate is down three points but considering a 9.5% SwStr% hasn’t budged, I’d say this is just some of his strikeout “luck” running out lately. And considering the mess that Boston has been, his one lonely win (again, against the Pirates) probably shouldn’t be a surprise. Pivetta’s ratios have also blown up, fueled by a home run rate that has ballooned from 1.0 HR/9 to 1.7 HR/9, and a .352 BABIP that’s up from a .257 BABIP in our first period.
So, that’s fewer strikeouts, more home runs, and a higher BABIP, all on a team that had been spiraling until recently. This is generally not a recipe for pitcher success.
Verdict: Cut when needed
Pivetta just finished the first leg of a solid two-step but can be cut if needed following his start in Baltimore. He’s just too much of a high variance player for me to prioritize a roster spot for. I’m sure he’ll turn in more good starts this season but Boston’s schedule isn’t exactly easy the rest of the way and Pivetta’s whiff rates and win probabilities don’t inspire a lot of confidence for him collecting W’s and K’s. And never forget that nothing can blow up your ratios quite like just one throwback performance from the once and future human gas can.
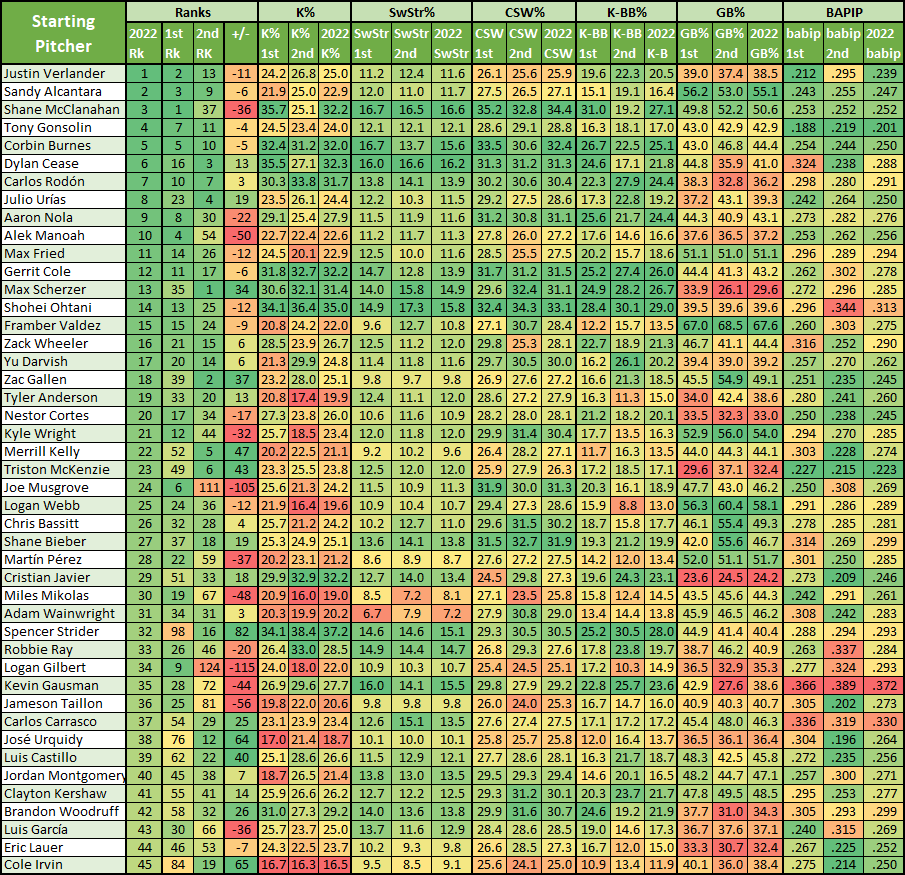
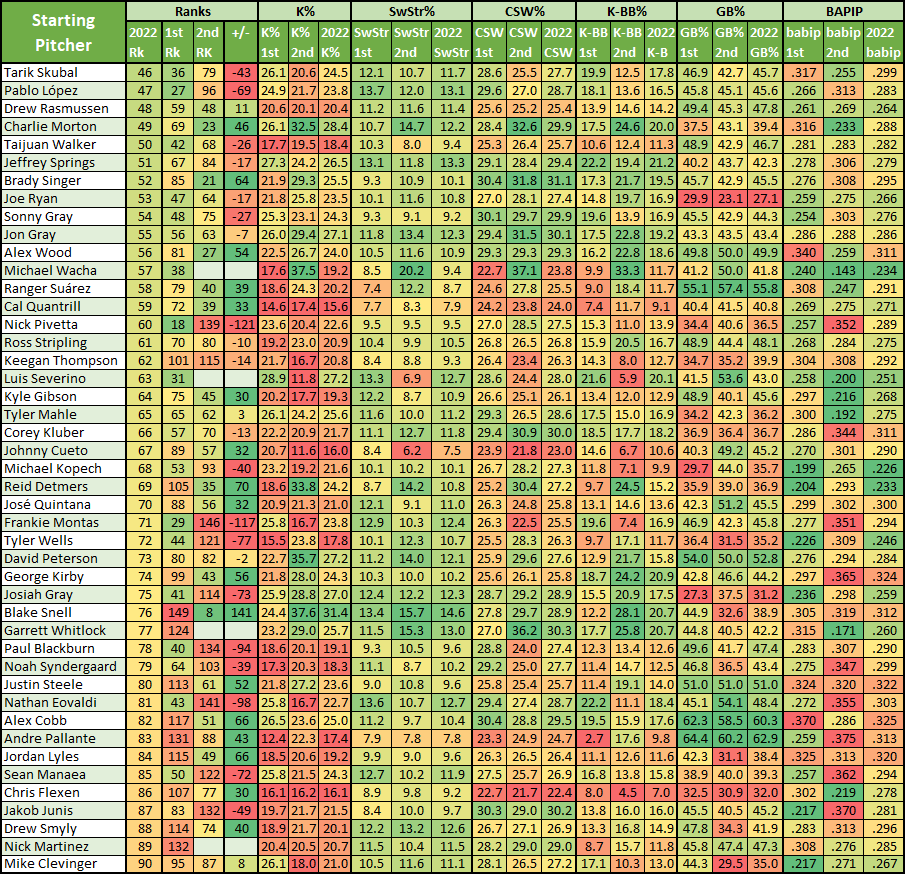
**Edit: Now With All-New Bonus Charts?**
Who doesn’t love more context presented in graphical form? Since the answer is no one (and because no gymnastics for my kids today equals bonus time for dad), here are the same pitchers from above but this time with a handful of other useful stats for the three periods. Enjoy and have a great weekend!
Yo this is article rules.
Thanks Yancy!
Super helpful, thanks! If anything, post it earlier in the season next year.
You’re welcome. Thank you for reading!
Pablo Lopez: Cut or keep starting?
Keep starting but with a very wary eye. He has seen dips in a lot of key areas but really hasn’t been helped by his recent schedule, with three of his past four starts coming against SD, ATL, and NYM. He’s definitely a go in his next start against OAK but the next week is probably a no go at home against the Dodgers.
Thanks for Bonus charts! Really useful stuff.
Absolutely, thank you for reading!
I cut Pivetta a long time ago…
Then you’re ahead of the game! But a >90% roster% on NFBC tells me a lot of people are still holding strong.
Great article – thanks!
You bet, thanks for checking it out!
Thanks. Getting harder to treat Hader as a no brainer given his recent struggles? What would it take to change your view on him in a redraft league?
Getting real freaking dicey, right? But given the ultra-high ceiling, I’d still need to see a few more meltdowns first.
Great article. Giolito? Cut or keep?
Given the upcoming schedule, I think you have to hold and bite the bullet…Two-start week vs BAL and ARI next week, followed by MIN (scary) and Oakland (opposite of scary. His upside is too high to cut but I reserve the right to rage drop him if he gets lit up by Baltimore.
Thanks
Also, thank you for reading!
What about Luis Garcia-time to cut and move on or hold for maybe better days?
Thanks
I’m holding but time is running out. If he gets roughed up in his next start by Minnesota, it might be time to move on. But if he’s decent, the schedule gets somewhat easier, currently lined up to face Texas back-to-back and then LAA/OAK.
Sorry for 2nd question-but I don’t see where Eovaldi went back on DL. While I agree with the possible cut it would be easier to stash him on DL-at least for me.
Don’t worry, we currently have no limits on questions…And I’m a moron – Eovaldi didn’t get put back on the IL, that must be me projecting.
Are there any particular RPs you are targeting? I play in a 12-team keeper league so if there is a stud middle reliever that could find a closer gig in 2023, that player would be high on my list. Maybe Andres Munoz? Joe Mantiply?
Thanks for the solid article, Nicklaus.
You had me at Andres Munoz – I just love him so much. And have already stashed him on a number of teams. But Mantiply is a good option too – good stuff, decent strikeouts, and regular usage.
I also like the Tampa Bay guys (Adam/Fairbanks, in particular). Their fluid roles make them too frustrating for regular (IE needing Saves) fantasy use but for an endgame strategy that can put counting stats on the back burner in favor of ratios/usage, I think they’re pretty viable…You know they’re getting used (and they’ll probably be good) and any random Saves/Wins you pick up will just be gravy.
And thank you for reading, I appreciate you checking it out!
What a sexy chart.
Zoom in close enough and you’ll notice the borders were finished in the finest of black lace.
Great article.. thanks for your work!!
Absolutely. I appreciate you checking it out.
These charts show what a crummy 2H Manaea has had – and that was before today’s (8/28) beatdown by the Royals (4 IP, 10 H, 6 ER). Hard to see any value in rostering him at this point, especially with his next 2 games being against LAD (they already crushed him in both meetings earlier this year). He gets a semi-breather @AZ on 9/15 but then faces STL and LAD again. I had high hopes for him after being traded to SD, but now… no thanks!