Is It Time to Move Past HR/FB Rate?
Mike Podhozer put out the following question the other day asking if is luck or skill that Brandon McCarthy has such a high HR/FB%.
Prove that Brandon McCarthy‘s HR/FB Rate is Not Just Bad Luck
I started looking at the question several ways and came up with a final conclusion that HR/FB is probably not the perfect stat to use when trying to determine if a pitcher has been lucky or unlucky giving up home runs.
Let me start by going off on a tangent. I am of the camp that players with a huge upswing are the reason groundball pitchers, like McCarthy, have a higher than expected home per fly ball rates. All but the most upward swings will get on top of a sinking ball and drive the ball downward into the ground. The hitter with an upswing will be the ones hitting this sinking pitch. In my opinion, each pitcher will have a subset of players who swing in line with his pitch plain and crush those pitches for home runs.
For the preceeding reasons, I think it is tough to just look at all fly balls. Most fly balls are outs. It is those few that are really hit solid which need to be examined.
Well, I am going to use Inside Edge’s batted ball data to look at hard hit fly balls. Besides just having the fly ball classifications, they label a fly ball’s contact as weak, medium or well-hit. The value I am going to concentrate on is well-hit fly balls. Of all the home runs hit from 2012 to 2014, Well-hit fly balls account for 85.6% all home runs, well-hit line drives are another 13.7% and medium fly balls are 0.6%. The key for a pitcher to limit the home runs he gives up is to minimize the well-hit fly balls and line drives. Of all batted balls, well-hit fly balls happens 7.5% of the time and well-hit line drives 10.8% of the time.
Looking at McCarthy, here are his values for the two batted ball types
Season: WH FB%, WH LD%
2012: 6.0%, 13.5%
2013: 9.5%, 10.6%
2014: 4.8%, 12.5%
2015: 25.8%, 12.9%
Career: 6.1%, 12.5%
His 2015 well-hit fly ball values are not even close to his career norm.
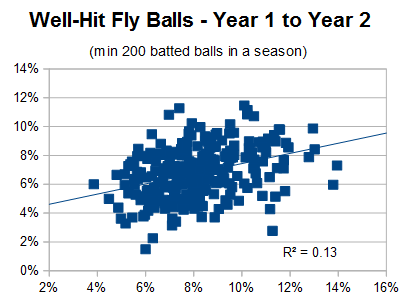
Then, I looked to see if pitchers had an ability to prevent the hardest hit data. The answer is NO with the data I have so far. The Inside Edge fly ball data showed some signs of possibly reaching a stabilization point at some time in the future, but looking at year-to-year and two years to one year data no strong correlation exists. Here is a plot of the well-hit fly ball from season one to season two (min 200 batted balls).
The fly drive data shows a small signs of correlation, nothing close to a stabilization point. Here is a plot of the line drive data
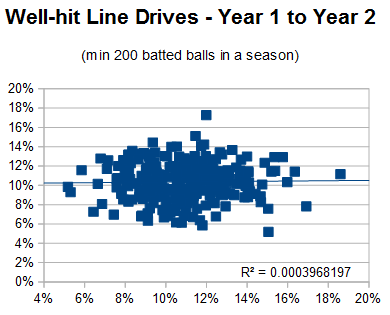
Exactly zero correlation here.
These results don’t surprise me one bit. Looking at just FB/FB rate, it takes around 9.4 years for it to stabilize (1239 fly balls). A skill which stabilizes in nine years is probably not the best to use. I think we need to move on from HR/FB.
So getting back to the original question of if the HR/FB is luck or not. Truthfully, I would ignore it. In the big picture, we are trying to see if a pitcher has a “skill” of giving up home runs. With the data freely available to the public, I would start with his HR/9 rate. It is quick, but not perfect. Currently, McCarthy has a 4.5 HR/9 in 2015 and a career value of 1.1 HR/9. We would expect his 2015 to be closer to his career numbers and/or the league average than the inflated rate.
While Fan Graphs doesn’t have the exact stat, HR/Batted Ball is a probably a better stat to use to see if a player has an elevated HR rate. It can be found by dividing HR by all batted balls (LD+GB+BUH+FB). It takes just less than three years to stabilize, so it will tell use quicker if a pitcher will give up more or less home runs than the average pitcher. Here are McCarthy’s values over the years:
Season: HR per Batted Ball Rate
2005: 6.2%
2006: 6.7%
2007: 2.6%
2008: 4.1%
2009: 4.1%
2011: 2.0%
2012: 2.7%
2013: 2.7%
2014: 4.0%
2015: 19.4%
Career: 3.7%
The major league average over the time frame is 3.6%. McCarthy looks to be a little more home run prone, but not a whole lot more than the MLB average. So looking into the question, I can’t “Prove that Brandon McCarthy‘s HR/FB Rate is Not Just Bad Luck”. In my opinion, it is back luck. From now on though, I don’t think HR/FB should be used. Some pitchers just don’t give up fly balls, but more of those fly balls will go for home runs. If we want to find if a pitcher is being lucky or unlucky with home runs, we should use HR/Batted ball. Ground ball pitchers like McCarthy will have less fly balls, but the few batters who do square up on his pitches may give it a ride.
Well, the preceding is quite a bit to digest. Basically, a year’s worth of home run has been historically worthless. Even looking at more precise batted ball data, year-to-year correlations don’t exist. Instead of HR/FB or HR/9, I will probably begin using home run per batted ball to help determine “luck” when looking to see if a pitcher giving up more home runs than the league average.
Jeff, one of the authors of the fantasy baseball guide,The Process, writes for RotoGraphs, The Hardball Times, Rotowire, Baseball America, and BaseballHQ. He has been nominated for two SABR Analytics Research Award for Contemporary Analysis and won it in 2013 in tandem with Bill Petti. He has won four FSWA Awards including on for his Mining the News series. He's won Tout Wars three times, LABR twice, and got his first NFBC Main Event win in 2021. Follow him on Twitter @jeffwzimmerman.
Good stuff, Jeff. Could be useful to have HR / Batted Ball % on players pages.