Introducing My Hitter xK%, Version 2.0
One of the best things about being a FanGraphs author is the ability to receive feedback and immediately act on suggestions from readers smarter than me to improve my analysis. I’m no math or data wiz, but have learned so much from just trying to develop equations over all these years that I could actually play one decently on the Internet now. A week ago, I shared a long overdue update of my hitter xK% equation. It incorporated metrics from Baseball-Reference.com, and performed darn well, clocking in with a 0.941 adjusted R-squared. Yet, it was still ripe for improvement.
Armed with comments from elkabong and Anon, I went back to work. The first order of business was to convert the per strike ratio variables into per pitch variables. That way we could incorporate how often a hitter sees a strike (or creates one by swinging at a ball outside the zone), in addition to how often the hitter has seen each strike type. While the original equation did account for this in a roundabout way, this new methodology is better.
Next, I added the final strike type variable that had been excluded, I/Str, which is the percentage of strikes put into play. After converting these strike type metrics to per pitch variables, this strike type vastly improved the equation.
Then, I changed the denominator of the HBP% variable from plate appearances to pitches. This was a “duh” switch and frankly I’m embarrassed that I chose plate appearances as the denominator in the first place! Pretty clearly it should have been pitches from the beginning.
Last, I removed intentional walks from all variables, so we’ll now be spitting out an expected strikeout percentage that excludes intentional walks. We’ll have to add back those intentional walks into plate appearances and then recalculate xK% from there to compare it to the hitter’s actual K%. Whenever I mention K% over the rest of the post, it’s the version that excludes intentional walks, unless otherwise noted.
My data set included all batter seasons with at least 50 plate appearances from 2014-2018, with a total population of 2,479.
xK%, Ex IBB = 0.909186676 + (L/Str/Pit%, Ex IBB * 0.625896864) + (S/Str/Pit%, Ex IBB * 0.874168815) + (F/Str/Pit%, Ex IBB * 0.431173882) + (I/Str/Pit%, Ex IBB * -2.420412818) + (3-0c/PA%, Ex IBB * -0.248395236) + (Pit/PA, Ex IBB * -0.133856623) + (HBP/Pitch%, Ex IBB * -2.574779611)
Adjusted R-Squared: 0.948
L/Str/Pit%, Ex IBB – strikes looking / total pitches, excluding intentional walks (IBB * 4 pitches)
S/Str/Pit%, Ex IBB – strikes swinging without contact / total pitches, excluding intentional walks (IBB * 4 pitches)
F/Str/Pit%, Ex IBB – pitches fouled off / total pitches, excluding intentional walks (IBB * 4 pitches)
I/Str/Pit%, Ex IBB – pitches put into play / total pitches, excluding intentional walks (IBB * 4 pitches)
3-0c/PA%, Ex IBB – 3-0 counts seen / plate appearances, excluding intentional walks
Pit/PA, Ex IBB – pitches / plate appearances, excluding intentional walks (IBB * 4 pitches in numerator & IBB in denominator)
HBP/Pitch%, Ex IBB – hit by pitches / total pitches, excluding intentional walks (IBB * 4 pitches)
*All data from Baseball-Reference.com
**Note that B-R.com’s PA total might be different in the section this data is pulled from, as it includes inning-ending baserunning outs that aren’t included in a typical PA count like FanGraphs displays
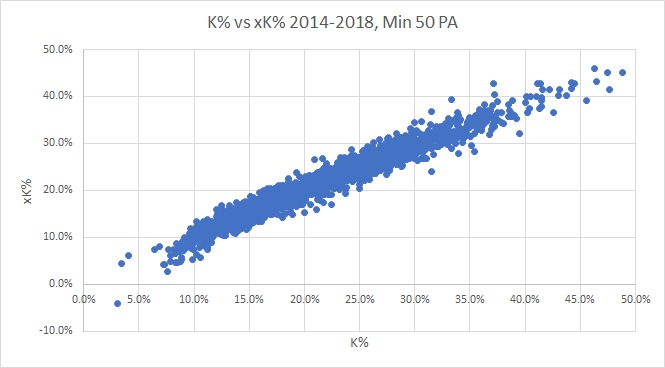
The additional work, thanks to our commenters’ suggestions, paid off! We have hit another new adjusted R-squared high.
Looking at the graph, I’m always amused when an equation of mine spits out a negative value. That -4.0% xK% is from none other than Willians Astudillo back in 2018. As owner of one of the most extreme skill sets in baseball, it’s fitting that he has broken the equation.
Let’s check out how each of those variables correlates with K%:
| Variable | Correlation |
|---|---|
| L/Str/Pit%, Ex IBB | -0.132 |
| S/Str/Pit%, Ex IBB | 0.783 |
| F/Str/Pit%, Ex IBB | -0.098 |
| I/Str/Pit%, Ex IBB | -0.789 |
| 3-0c/PA%, Ex IBB | -0.111 |
| Pit/PA, Ex IBB | 0.383 |
| HBP/Pitch%, Ex IBB | 0.002 |
If you sort from most positive to most negative, you’ll find that S/Str is most positively correlated, while I/Str is most negatively correlated. The two variables have nearly identical correlations, except opposite. Obviously, this makes sense, as a swinging strike is one of two strike types that you could strike out on, while putting the ball in play ends the plate appearance and any chance of striking out. I was surprised to find HBP/Pitch% have almost zero correlation, but it did have a minor positive impact on the equation’s R-squared and I would imagine it improves the accuracy of hitters who regularly lead the league in hit by pitches.
Finally, I took some of commenter Alexander Rinaldi’s advice. I added each variable step by step to ensure each addition actually improved the R-squared, rather than throwing them all in together at the very beginning.
It was also requested to check for multicollinearity, which is often times a problem when using many metrics as hitters good at Variable X are typically good at Variable Y as well. Let’s check that:
| L/Str/Pit%, Ex IBB | S/Str/Pit%, Ex IBB | F/Str/Pit%, Ex IBB | I/Str/Pit%, Ex IBB | 3-0c/PA%, Ex IBB | Pit/PA, Ex IBB | HBP/Pitch%, Ex IBB | |
|---|---|---|---|---|---|---|---|
| L/Str/Pit%, Ex IBB | 1 | ||||||
| S/Str/Pit%, Ex IBB | -0.582 | 1 | |||||
| F/Str/Pit%, Ex IBB | -0.608 | 0.132 | 1 | ||||
| I/Str/Pit%, Ex IBB | -0.109 | -0.427 | 0.294 | 1 | |||
| 3-0c/PA%, Ex IBB | 0.246 | -0.300 | -0.364 | -0.262 | 1 | ||
| Pit/PA, Ex IBB | 0.317 | -0.008 | -0.296 | -0.829 | 0.396 | 1 | |
| HBP/Pitch%, Ex IBB | -0.048 | 0.025 | 0.068 | -0.051 | -0.049 | -0.056 | 1 |
This matrix looks pretty darn good from the perspective of hoping for relatively low numbers. The only possible cause for concern is the cell highlighted in red that shows the correlations between Pit/PA and I/Str. Of course that’s going to be highly negative, as the more pitches a batter sees during a plate appearances, the lower the rate of balls in play per pitch is going to get. I tested removing each of the variables individually, but it dramatically reduced the equation’s R-squared, so both are clearly necessary.
Lastly, the P-values of each variable are all well below .05, with two sitting at 0, and the rest with 0s going out to at least 26 decimal places. We are definitely good there!
Mike Podhorzer is the founder of ProjectingX IQ, an advanced fantasy baseball analytics platform that transforms projection data and in-season performance signals into actionable intelligence. He is the 2015 Fantasy Sports Writers Association Baseball Writer of the Year and three-time Tout Wars champion. He is the author of the eBook Projecting X 2.0: How to Forecast Baseball Player Performance, which teaches you how to project players yourself. Follow Mike on X@MikePodhorzer and contact him via email.
This is what makes Fangraphs so great; the sharing of knowledge between people, which leads to us having a better understanding of why things happen as they do in baseball.
Great stuff. Congrats to both of you.
Mike- What possible use is a non predictive metric for fantasy or real baseball?