
Humanity vs. the Robots: Round 2

Earlier this week when I detailed what is sure to be the most important human versus machine debate our society will face, I found that the projection robots very narrowly edge the ADP market when it comes to predicting fantasy performance. That analysis, though, was based on a half-season of 2026 data with a hint that there might be more to come.
This is that follow-up. My goal here was to conduct a broader analysis on more data to see if the conclusions held up, and it turns out that they did.
Intro
To expand my analysis to a longer sample, I needed dollar values for past projections. FanGraphs offers past ZiPS and Steamer forecasts for members, and I chose Steamer because it is designed with fantasy baseball more explicitly in mind and downloaded past forecasts for 2021 through 2025.
The problem, though, is that the past forecasts don’t come with dollar values preassigned – that function exists only in the Auction Calculator and Player Rater. To this end, I had to reconstruct the dollar values based on the raw data. Because of legwork involved, I analyzed the sample for standard 5×5 roto settings and not ESPN and Yahoo points as I did early in the week. Given the results in that analysis were broadly similar across setting, I feel the same can be reasonably generalized here, though it might be worth looking into for a (relatively) quick future analysis.
I won’t go into full detail about how dollar values are constructed, but will note that there is a methodological nuance involved with how the Auction Calculator creates them I didn’t directly replicate. According to erstwhile RotoGraphs author Lucas Kelly, the groupings that the AC uses to determine the position adjustments are calculated with an optimization process that iterates over many random samples to eventually converge on the best performing pool of players.
This exceeds my technical capabilities at this time, so I chose simpler methods of creating my groups to assign position adjustments. For the projected values, I assigned groups based on the order of positional scarcity; i.e., how many relatively high drafted players were available at that position in a given year. More scarce positions got the priority of talented players who were multi-eligible. For the projection data, I used ADP as a proxy for ordering players based on talent. This is obviously not perfect, but in my opinion represents a fair representation of what the draftable player pool was at that time.
Additionally, I didn’t feel comfortable using the actual year end dollar values created from the Auction Calculator because I didn’t have full transparency into that calculation. So, to create an actual year-end dollar value for each player, I replicated my own process over the raw data for real year-end stats with a slight tweak on the method for creating the pools for positional adjustment. Instead of using ADP, I created an initial run of z-scores on performance for the full player pool of a given year and simply sorted the list to create the order of players used to fill the position groups. I figured that since I have actual performance data, I should use that to create the pools.
This ends up with a (mostly) apples-to-apples comparison of the projected dollar values versus actuals. As a sanity check, the correlations of my created dollar values and the dollar values exported from the auction calculator were all greater than 0.9 so overall, I felt comfortable that they were a reasonable reproduction.
Analysis
With these data, I essentially just replicated the same analysis that I did in Monday’s article. First, I compared the correlations of ADP based rank and projection-based rank with the year-end dollar values for each season:
| Season | ADP Rank vs. Actual $ | Projected Rank vs. Actual $ | ADP Rank vs. Projected Rank |
|---|---|---|---|
| 2021 | 0.37 | 0.46 | 0.69 |
| 2022 | 0.48 | 0.56 | 0.81 |
| 2023 | 0.45 | 0.58 | 0.81 |
| 2024 | 0.41 | 0.45 | 0.75 |
| 2025 | 0.45 | 0.55 | 0.81 |
As in the 2026 sample, projection-based ranks slightly but consistently outperform ADP-based ranks. It is interesting, if unsurprising that 2021 featured the worst correlation for ADP nearly the worst correlation for projections. Following the truncated 2020 season was certainly a challenge for both forecasters and the draft market, which is reflected here.
Across the entire pooled sample, the results are naturally quite similar:
| Comparison | Correlation |
|---|---|
| ADP Rank vs. Actual $ | 0.43 |
| Projected Rank vs. Actual $ | 0.52 |
| ADP Rank vs. Projected Rank | 0.77 |
I then conducted the same Steiger Z-Test to see if the gap between the first two correlations listed above is significantly (in the statistical sense) different:
| Comparison | r (ADP vs Act) | r (Proj vs Act) | r (ADP vs Proj) | N | p-value |
|---|---|---|---|---|---|
| ADP Rank vs. Proj Rank | 0.43 | 0.52 | 0.77 | 1920 | 0.000 |
As before, the relationship is indeed significant to a high degree. Comparing the relationship on a scatterplot with a smoothed trend line, we find more of the same.
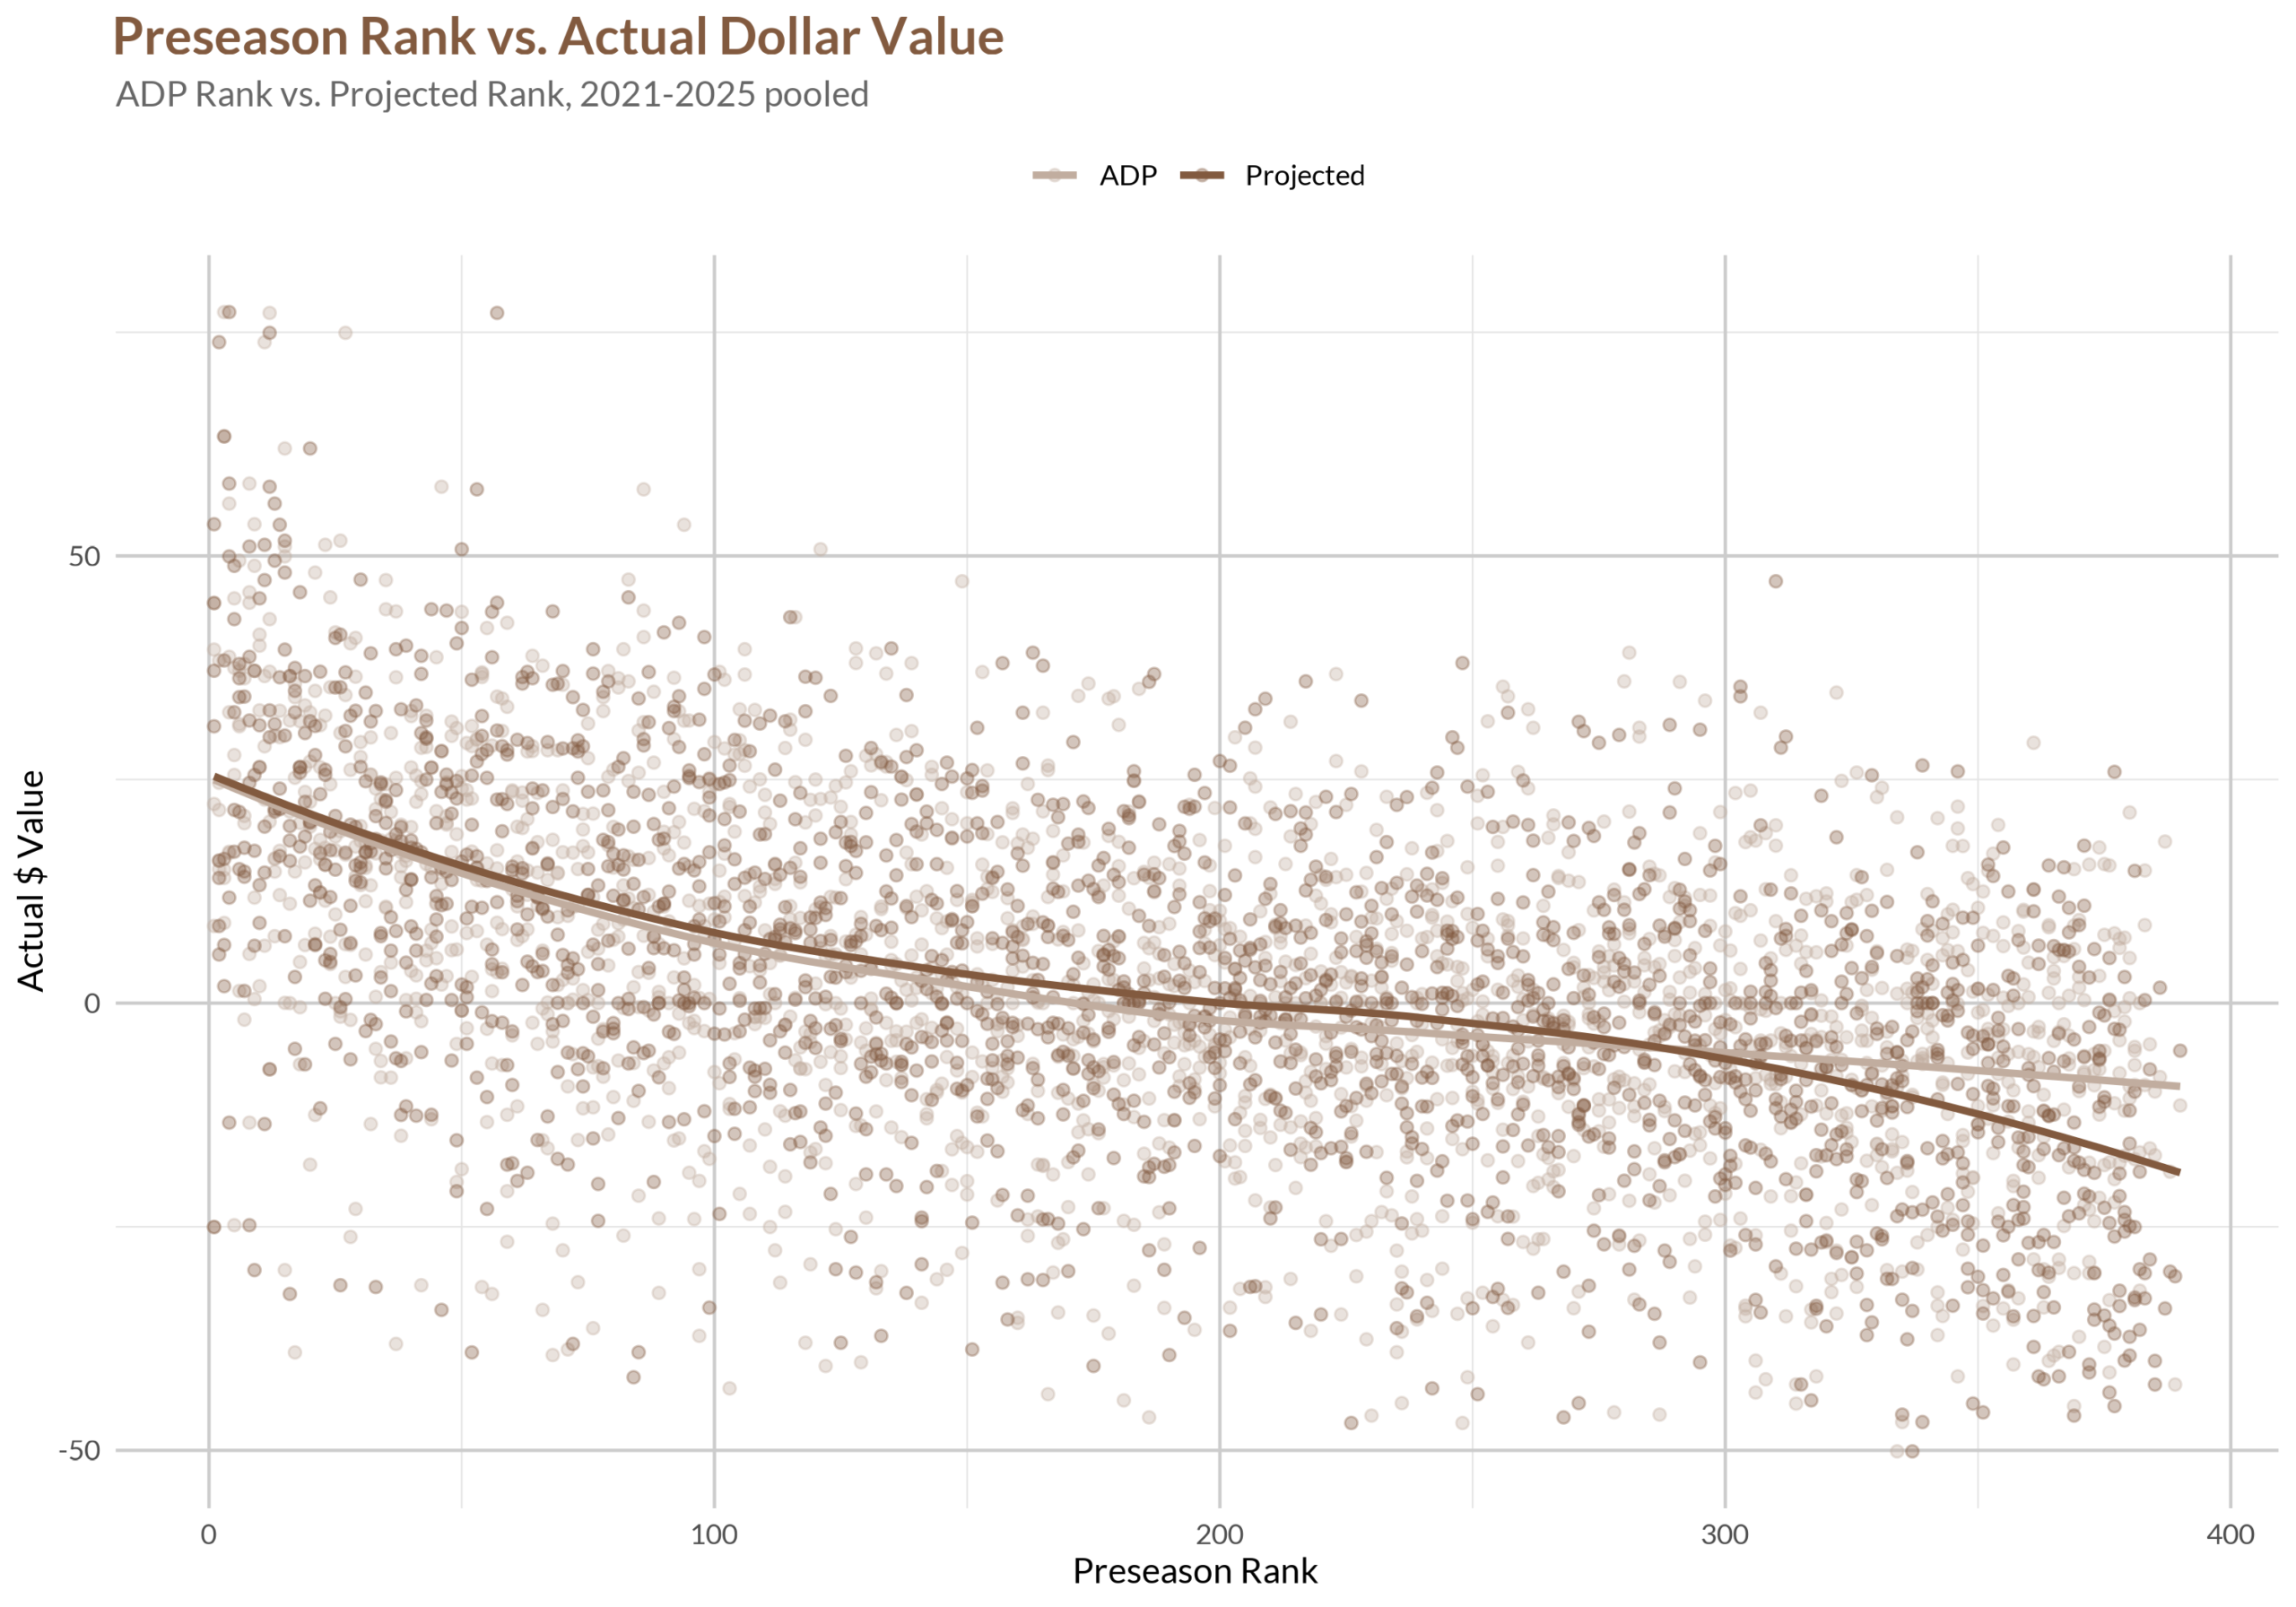
It is somewhat difficult to see, but there is daylight between the trendlines for ranking methodologies starting around the back half of the top 100 ranks. This difference is small but persistent until roughly the 300th rank.
As a note, it is interesting that the trend line for the projection-based rank dives so far below the ADP-based line at the back end of drafts. This was also the case in my 2026 focused analysis, and it is isn’t showing up very well in the decomposition buckets. I haven’t placed too much weight on this finding due to the inherent volatility of picks and values that deep into the talent pool, but perhaps this is worth a look in a future analysis.
Deep Dive
Welcome to the rapid-fire table section. I again created buckets (this time in 50-pick samples to 350) and isolated for players who are uniquely preferred by a given rank method (i.e., the other method must rank the player at least one bucket lower) within that bucket and compared the average value of players:
| Group | 1-50 | 51-100 | 101-150 | 151-200 | 201-250 | 251-300 | 301-350 |
|---|---|---|---|---|---|---|---|
| ADP-Favored | $13.90 (75) | $2.45 (102) | $-1.64 (104) | $-6.15 (110) | $-8.98 (112) | $-8.44 (93) | $-17.40 (55) |
| Proj-Favored | $14.52 (75) | $8.78 (104) | $2.67 (122) | $2.02 (121) | $-0.49 (119) | $-1.17 (87) | $-9.51 (40) |
Here, the players preferred by projection-based ranks perform better across the board, though not materially so until after the first bucket. I then compared the frequency with which certain position groups are favored for each rank method, with above and below rank 50 serving as the cutoff, since that is where the values began to diverge meaningfully in the sample.
| Position Group | Count – Proj. | Share (%) – Proj. | Count – ADP | Share (%) – ADP |
|---|---|---|---|---|
| Hitter | 21 | 35 | 47 | 81 |
| RP | 7 | 11.7 | 4 | 6.9 |
| SP | 32 | 53.3 | 7 | 12.1 |
Within the top 50, Relief pitchers are slightly more favored by projections, but starting pitchers are actually the dominant group. Beyond the top 50, the results are similar, but tilted more toward relief pitchers relative to the top of the draft. This makes sense; there are simply going to be fewer relievers ranked in the top 50 to begin with.
| Position Group | Count – Proj. | Share (%) – Proj. | Count – ADP | Share (%) – ADP |
|---|---|---|---|---|
| Hitter | 69 | 23.1 | 147 | 70.3 |
| RP | 91 | 30.4 | 16 | 7.7 |
| SP | 139 | 46.5 | 46 | 22 |
Now for the real question – how do the values of these groups shake out? For the top 50 ranks, projections uniformly prefer better performing pitchers, while ADP prefers better performing hitters:
| Rank Pref | Role | Avg $ (All) | Avg $ (>$0) |
|---|---|---|---|
| ADP | Hitter | $14.21 (62) | $23.25 (47) |
| ADP | RP | $16.76 (4) | $16.76 (4) |
| ADP | SP | $10.51 (9) | $16.66 (7) |
| Proj | Hitter | $7.29 (29) | $17.44 (21) |
| Proj | RP | $22.42 (7) | $22.42 (7) |
| Proj | SP | $18.48 (39) | $24.29 (32) |
After the top 50, the picture is blurred somewhat among positive-performing players. Among the full pool of players preferred by each rank method, players whom projections prefer (say that five times fast) are uniformly better across groups on average, though not by overwhelming margins.
| Rank Pref | Role | Avg $ (All) | Avg $ (>$0) |
|---|---|---|---|
| ADP | Hitter | $-7.97 (456) | $11.72 (147) |
| ADP | RP | $3.17 (32) | $13.39 (16) |
| ADP | SP | $2.14 (88) | $13.09 (46) |
| Proj | Hitter | $-3.74 (185) | $12.51 (69) |
| Proj | RP | $5.23 (146) | $11.69 (91) |
| Proj | SP | $3.33 (262) | $14.08 (139) |
This tracks with what we saw earlier in the week with an interesting addendum – perhaps the edge we granted relievers earlier in the week can be expanded to all pitchers now that we have a better sample. This is another interesting finding that I’ll earmark to poke around with in the future. The sample size of players in the 2026 analysis was much smaller, and it could be that Jacob Misiorowski is single-handedly elevating the pool of ADP-preferred starting pitchers. Meanwhile, with a much larger sample, projections win out in the end.
Likewise, the finding regarding player age also held up. The sample of players younger than 25 and in the top 50 of either projection rank is small, but ADP more frequently identified good players:
| Setting | Avg $ (All) | Avg $ (>$0) |
|---|---|---|
| Proj-favored | $16.07 (2) | $16.07 (2) |
| ADP-favored | $23.95 (10) | $28.05 (9) |
To get around the sample size issue, I expanded the pool to the the top 150 rank places:
| Setting | Avg $ (All) | Avg $ (>$0) |
|---|---|---|
| Proj-favored | $1.43 (15) | $9.82 (8) |
| ADP-favored | $0.61 (43) | $22.82 (20) |
Interestingly, among this pool, the projection-preferred players are slightly better. However, among the ultimately positive-performing players each method prefers (another tongue twister), ADP is clearly superior. To me, this looks like a boom-and-bust pattern; the market is simultaneously preferring young players who both crash out and soar. I would still broadly count this as a win in the ADP bucket, given the list of players preferred by projections was pretty underwhelming, despite being slightly better on net:
| Season | Name | Age | Role | Projected Rank | ADP Rank | Projected $ | Actual $ |
|---|---|---|---|---|---|---|---|
| 2021 | Yordan Alvarez | 24 | Hitter | 48 | 76 | $19.26 | $21.19 |
| 2021 | Nick Madrigal | 24 | Hitter | 77 | 181 | $16.72 | $-24.34 |
| 2021 | Dustin May | 23 | SP | 88 | 190 | $15.96 | $-1.27 |
| 2021 | Alejandro Kirk | 22 | Hitter | 116 | 298 | $13.56 | $-12.30 |
| 2021 | Garrett Crochet | 22 | RP | 142 | 350 | $12.11 | $1.57 |
| 2022 | Keibert Ruiz | 23 | Hitter | 102 | 169 | $13.95 | $-3.51 |
| 2022 | Alejandro Kirk | 23 | Hitter | 128 | 229 | $12.00 | $14.56 |
| 2022 | Shane Baz | 23 | SP | 133 | 170 | $11.69 | $-5.66 |
| 2023 | Andrés Muñoz | 24 | RP | 67 | 163 | $16.38 | $9.68 |
| 2023 | Hunter Greene | 23 | SP | 80 | 104 | $15.18 | $-3.37 |
| 2023 | Grayson Rodriguez | 23 | SP | 146 | 186 | $10.15 | $2.57 |
| 2024 | Grayson Rodriguez | 24 | SP | 46 | 65 | $20.72 | $10.95 |
| 2024 | Wyatt Langford | 22 | Hitter | 69 | 128 | $17.69 | $7.65 |
| 2024 | Riley Greene | 23 | Hitter | 71 | 141 | $17.55 | $10.37 |
| 2025 | Taj Bradley | 24 | SP | 148 | 200 | $10.95 | $-6.68 |
That’s it; that’s the list. There are a few good players here, but the best result is Yordan Alvarez’s worst full season. Compare it to the top 15 on the ADP side:
| Season | Name | Age | Role | ADP Rank | Projected Rank | Projected $ | Actual $ |
|---|---|---|---|---|---|---|---|
| 2021 | Bo Bichette | 23 | Hitter | 24 | 83 | $16.25 | $45.36 |
| 2021 | Vladimir Guerrero Jr. | 22 | Hitter | 50 | 56 | $18.65 | $43.75 |
| 2023 | Corbin Carroll | 22 | Hitter | 66 | 165 | $9.26 | $37.72 |
| 2024 | Gunnar Henderson | 23 | Hitter | 29 | 118 | $13.26 | $36.49 |
| 2025 | Junior Caminero | 21 | Hitter | 92 | 120 | $12.80 | $36.37 |
| 2023 | Bobby Witt Jr. | 23 | Hitter | 17 | 69 | $16.26 | $35.71 |
| 2024 | Elly De La Cruz | 22 | Hitter | 27 | 138 | $11.48 | $34.44 |
| 2021 | Rafael Devers | 24 | Hitter | 40 | 54 | $18.75 | $32.10 |
| 2025 | Pete Crow-Armstrong | 23 | Hitter | 136 | 279 | $3.78 | $29.98 |
| 2025 | James Wood | 22 | Hitter | 51 | 137 | $11.76 | $22.75 |
| 2022 | Bobby Witt Jr. | 22 | Hitter | 96 | 194 | $7.88 | $21.72 |
| 2024 | Jackson Chourio | 20 | Hitter | 127 | 172 | $9.56 | $18.84 |
| 2023 | Gunnar Henderson | 22 | Hitter | 83 | 135 | $11.02 | $11.70 |
| 2023 | Michael Harris II | 22 | Hitter | 31 | 61 | $18.09 | $11.39 |
| 2021 | Ian Anderson | 23 | SP | 88 | 171 | $10.61 | $10.22 |
That’s 15 players with value higher than $10, and a few super-duper star turns. Your opinion may differ but I would generally take a roughly one in three chance to land a player of that caliber over drawing from a slightly more stable pool with a lower ceiling.
Conclusion
There you have it, some 4000-plus words and two articles later. Projections really do seem to be better at creating a ranking that predicts year-end player value than ADP. Early in rankings, the advantage is muted but seems primarily centered on pitching, and exists across the board once you get past the top 50 or so ranks. Meanwhile, the market does seem reliably better at preferring high ceiling young players who eventually become impact fantasy performers.
That isn’t where this ends, though – there are numerous new avenues for research, like the ones I’ve already mentioned but also others, such as figuring out why projections tend to prefer better pitchers, and whether this is something that we can predict come draft time. To that point, hopefully this is just the tip of the iceberg as we continue our journey on player valuation.
Jonathan is a contributor for RotoGraphs. He is a Tigers fan living in Philadelphia with his wife and dog and requests that you leave your best pizza topping combinations in the comments.