How to Interpret a Mock Auction
If you follow me on Twitter (or read my last article), you know that I have been deep into a mock auction with a set of 13 other Ottoneu experts. As I am writing, we are nearing 460 players auctioned, leaving us just 20 guys from the finish line. By the time you are reading, we may be done!
With the completion of the auction, Ottoneu players will have 480 new data points to consider as they are planning for their 2022 seasons, and there has been discussion in the Ottoneu community about how to think about, interpret and use those new data points. I wanted to offer my thoughts on how I would use this mock auction – and how I wouldn’t.
First, some general thoughts on the structure:
- This is a first-year league, not an existing league. With no keepers and no inflation, prices will generally be lower for guys here than for the same players available in the auction for an existing league.
- This league is full of experienced Ottoneu managers and as a result is not a perfect analogy for a new league with new managers. I’ll get into how that is impacting some of my thinking below.
- This is a slow auction (guys are up for bid for 12+ hours rather than a couple minutes). That impacts how much research people can do and how much thought they can put into bids.
- This is still early in the off-season, so we don’t know where everyone will land, we don’t know what rosters will look like…I am not even sure we know how long the season will be! By the time you auction, you’ll have a lot more info.
With those basics out of the way, here are things I am keeping in mind as I use this auction to re-evaluate my 2022 plans.
Mock Auctions Represent a Market, not a Manager
We see a ton of mock drafts this time of year, and we are starting to get real draft results in, as well, but a single draft can be misleading because it only takes one manager to set the price for a player. For example, in the Pitcher List mock I participated in, I took Marcus Semien with the 19th pick. His current ADP at NFBC is 26.7. My taking him 19th doesn’t reflect his market value. And who knows how long he might have lasted had I passed on him.
A mock auction, on the other hand, requires at least two managers to roughly agree on a value to set a price. I think Max Kepler is probably a $6-$7 guy, but no one else was willing to go over $3, so I got him for $4. This gets us a lot closer to true market value. So I am more willing to look at individual data points from a mock auction than a mock draft – they tell me more. I look at an individual mock draft as showing me a possible “highest cost” for a player; I look at this mock as showing me an (admittedly noisy) estimate of market value.
Every Auction is Unique
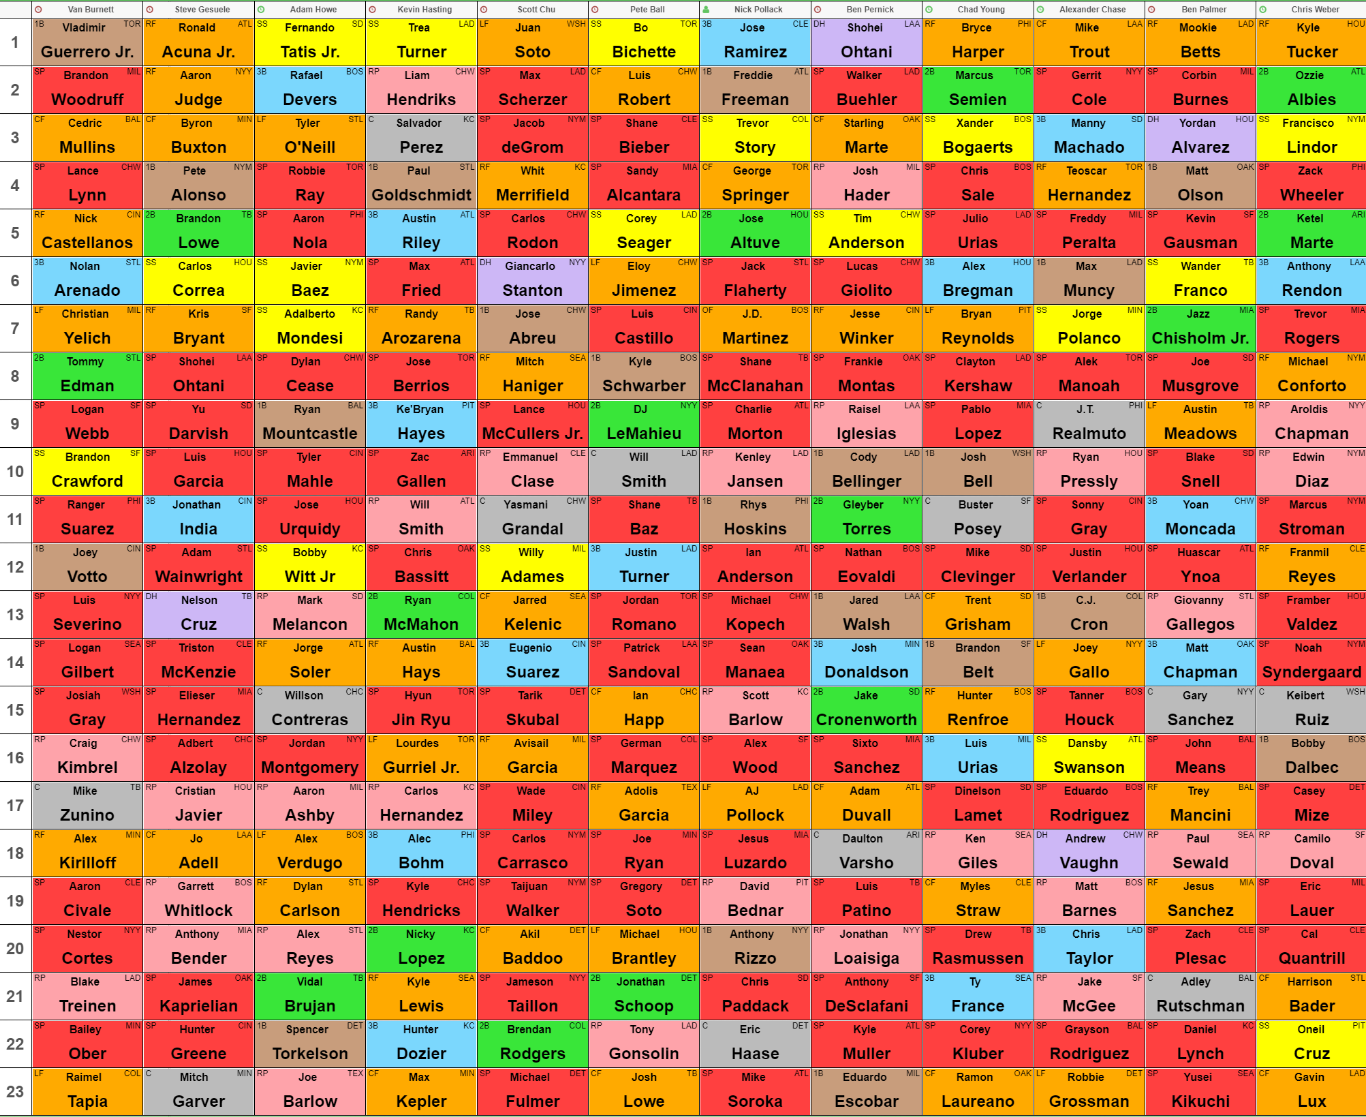
There are interactions between players being drafted that impact values in unexpected and variable ways. Juan Soto going for $75 as the second player off the board both sets the market and changes how much at least one team can spend on other OF going forward. If we had stopped at $70 fo Soto, $55 for Vladimir Guerrero Jr., and $40 for Freddie Freeman, someone else would have gotten more expensive. So every data point you see here could be high, low or in the middle of the player’s range. You can’t just assume the prices in here represent prices in another auction.
Slow Auctions Mean Fewer Values
In a regular auction, you have a matter of seconds to see who is nominated, figure out if they fit a need, determine a value, and bid. At least for me, that matter of seconds also often includes kids, dogs, my wife, snacks, beer…other stuff in general. As a result, there are inevitably players in every auction where the bidding ends and everyone is stunned at how cheap the player went. A couple people were waiting for the bidding to get higher, a couple people looked away cause they didn’t need a 3B, and suddenly a guy we all thought should be $10-$15 went for $5.
In a slow auction, we have at least 12 hours to see who is nominated, do some research, look at our roster, and make a call. So no one slips through the cracks. That isn’t to say there are no values – you still hit a point where not enough managers have enough cash to bid, for example – but there are fewer chances for guys to sneak through.
This also means that there are fewer overpays. Every auction I have been in has a few guys in the middle or end who go for way more than expected because the early values mean a few teams have cash to burn. If the early prices are more accurate – and I think they are – in a slow auction, the later prices are, too.
As a result, I think the prices in a slow auction are more reflective of how managers value players and less reflective of the vagaries of a live auction. That is useful in helping me rethink my values (where was I too high or too low?) but not as useful in thinking about how my live auctions will actually play out.
It’s Still Just One Data Point
Don’t take a mock like this as gospel. This is still just 12 teams with 14 managers making decisions in early December. I can’t speak for anyone else, but I know that my values will change quite a bit before February. Given we started before the flurry of pre-lock-out signings, some of our values have probably changed already. Like I said above – noisy estimate of market value; no more.
For a First-Year League, This is a Sanity Check
As discussed, you can’t assume players will go for the same or even similar prices in your auction. Changes in information, in the managers involved, in the order of players nominated, etc., will all change the prices. But it is a useful sanity check – if you are thinking you might bid $10 for a guy who went for $5 here, it is probably worth a second look to figure out why there is a discrepancy. If you think you might get a guy for $5 who went for $10 here, you might want to have a backup plan in case that guy goes for $10 in your auction, too.
That doesn’t mean this auction is “right” and yours is “wrong” – they are both reflections of the market value of a player filtered through a different auction. But seeing prices from an auction like this can help you re-evaluate your priors and figure out where you might have missed something or where you might be able to benefit from your differentiation from the market as a whole.
For an Established League, This is More Like a Ranking
While the values for an established league can vary wildly from league to league and certainly from a first-year auction like this one, you do start to get a sense of rankings and tiers from a data point like this. At least rankings and tiers according to this group of managers. For example, I don’t think you can assume that Josh Donaldson will go for $19. But I do think you can start to identify that he may be in a rough tier with Kris Bryant, Anthony Rendon, and Nolan Arenado. And that Austin Riley and Alex Bregman are above them, while Justin Turner and Yoan Moncada are below.
Again, this is just one data point based on one mock, so you can’t take it as gospel. But because it represents values filtered through all 12 managers, it is (I think) more useful than looking at the rankings from a single writer or projection system. And, as with the first-year league advice, you can use that to re-evaluate your priors. If Donaldson being in a tier with Arenado feels wrong to you (after all, Donaldson is 36 with an injury history), you can look at why the might be in a similar tier (wow, Donaldson has been a lot better the last two years, but has played 40 fewer games over that time). Maybe that helps you rethink your plans by moving someone up or down, or maybe it helps you solidify your trade or auction targets because you value one much higher than the other.
You Can’t Easily Assume Inflation
Inflation is never linear and can be hard to predict. If you expect 20% inflation in your league, you can’t just take these prices and bump them by 20%. There’s a few reasons for this. First, inflation tends to hit elite players hardest – they are the scarcest resource with the fewest alternatives, so teams will push harder for them in auction. Second, in this auction, as I noted above, I think some players went for near-inflation-level prices already. Third, inflation often gets “bunched” on players with a lot of hype. Some $4 OF that is a popular sleeper pick will get bid up to $10 by a group of managers who all targeted him as a late-auction pickup and don’t have alternative options left.
So I basically don’t use these values to assume inflation. I use them for what they are – reflective of market price in a first-year league.
More Useful than Average Salaries…For Now
Average salary data is really useful for Ottoneu but it is very messy, too. There’s a $9 Juan Soto out there. A $10 Ronald Acuña, Jr., too. Some leagues haven’t had a chance to bid on those two since they entered the league. So their average salaries don’t reflect market value.
You can filter down to first-year leagues, but that data is mostly nine months out of date at this point. You can look at the last ten adds for a player, but that will include in-season pick-ups, which skew the data. By the time we are in the heat of auction season, those two data points will be more useful, and they’ll supplant this mock (or any other early auctions, mock or real) as the best data points for understanding market values. For now, those other data points don’t exist, and so the mock is more useful.
A long-time fantasy baseball veteran and one of the creators of ottoneu, Chad Young's is the Managing Editor for RotoGraphs, and can be heard on the Keep or Kut Podcast. You can follow him on Bluesky @chadyoung.bsky.social.
Dealing with inflation is tricky. I add an inflation factor to the top names in the draft and then wing it after that. This mock draft will be a good resource for draft prep.
I have found inflation to be 1.6 in my keeper leagues. 20% doesn’t come close.
I’ve gotten away from applying a linear multiplier for inflation. Value is not distributed linearly (check out the auction calculator and graph the results) and neither is perceived value (do the same thing with average salaries). I have gone to using a logarithmic distribution based on players and salary remaining. This method also helps you budget your own team, since you’ll end up with a very extreme “stars and scrubs” approach if you only use linear inflation and simply bid up to what you think everyone is worth. There’s definitely some math maneuvering involved to come up with the equation, but it was worth it for me.
My method: I have found that there is about 30-31 players per team that I would consider “above replacement”. For simplicity, let’s say there’s 360 players in that group. So for x = 361, y = $1. Furthermore, we know there is $4800 of salary out there. So the area under the graph from x = 1 to x = 480 must be $4800. That takes some light calculus, but it’s easy enough to find on the internet (I haven’t taken a calculus class in probably 20 years, that’s what I had to do). This is your starting point. As players come off the board, your values of 361, 480, and $4800 decrease accordingly. Once you solve the initial equation, you can use Excel to update it based on the new values of the three numbers (above replacement players remaining, roster spots remaining, and salary remaining). You can do the same thing for your team, only starting from 31, 40, and 400 respectively.
So you don’t have to go through all that mess (it is slightly messy), the generic equations are as follows:
Salary of the xth most valuable player: A*ln(x) + B
Equation for A: A = (S + 1 – R)/(1 + ln(N) – R – R*ln(N) + R*ln(R))
Equation for B: B = 1 – A*ln(N)
where: S = salary remaining (starts at $4800 for league/$400 for team), R = roster spots remaining (starts at 480 for league/40 for team), N = number of above replacement players remaining (starts at whatever you determine, although I’ve found it to be about 360 for league/30 for team)
If we test this using N = 361, R = 480, and S = $4800, we find that for x = 1 (i.e., the most valuable player, aka Juan Soto this year per the auction calculator), the equation spits out $76.652. Soto went for $75 in the draft linked, so it seems reasonable. Tatis was the first player drafted, and is the third highest valued player on the draft calculator (applying a 60/40 batter pitcher split). His value per this equation is $62.538, he went for $57.
I tried this last year at a non-first year auction for OttoNeu and I really thought it worked well. I had my list of best remaining players to fill out my team, and this method auto-budgeted for me. I wasn’t rigid with it, but it really kept me on budget and helped me save for the end of the draft without missing out on some of the top players available at the same time. The beauty of this is it works for any auction draft, not just OttoNeu, since it’s generic and flexible enough to accommodate different salaries and roster sizes. I even use it to help me determine who to nominate, putting up players who I feel I don’t think I’ll pay for or players who I can get at a bargain early on if I feel there’s bigger fish out there that people are saving up for.