
How a Starting Pitcher Performs When Immediately Facing the Same Lineup
Today’s article has been a couple of weeks in the making. I know it came up when one of my co-managers, Fred Zinkie, asked how much a pitcher’s performance changes if they immediately reface the same team. I don’t remember the pitcher or team involved but I didn’t know the answer so I’d find it out. The obvious answer is sure, a pitcher will be worse. It makes sense that the team that just faced him will have some familiarity. Two questions do come up though. First, how much does the pitcher’s performance degrade in the second matchup? Next, if there is a familiarity factor, how long does it take to go away? After examining the data, a small factor exists and quickly disappears.
Simply, this is one of the noisiest, possibly biased studies I’ve ever worked on. First, a starter usually doesn’t see a team right away since schedules have quite a bit of variation in them. This limits the sample size. Second, the data is clumped at five-day multiples because the starters need rest. I begged for a possible solution on Twitter but no solution was found. Even with the limitations, I forged ahead with some workable results.
To get the data, I paired up starters who had one start against a team and then X days later made another against the same team. Since 2010, I collected the difference in several rate stats and length of start (innings and pitches). With such short time frames, an ERA over 100 could completely throw off an average so I found the median values. Using those settings, here are the results:
| Days Since Facing the Team | ERA | K/9 | BB/9 | H/9 | Pitches | IP | Win% | Count |
|---|---|---|---|---|---|---|---|---|
| 5 | 0.45 | 0.00 | 0.00 | 0.09 | 0.0 | 0.0 | -2% | 543 |
| 6 | 0.00 | -0.02 | 0.00 | 0.08 | 1.0 | 0.0 | -1% | 709 |
| 7 | 0.80 | 0.03 | 0.00 | 0.08 | -2.0 | 0.0 | 2% | 165 |
| 8 | 0.00 | -0.21 | 0.07 | -0.08 | 0.0 | 0.0 | 4% | 45 |
| 9 | 0.14 | 0.00 | 0.14 | 0.00 | 2.0 | -0.3 | -9% | 45 |
| 10 | 0.28 | 0.00 | 0.01 | 0.07 | 0.0 | 0.0 | -4% | 499 |
| 11 | 0.00 | 0.00 | 0.00 | -0.03 | 0.0 | 0.0 | -2% | 803 |
| 12 | 0.00 | 0.00 | 0.02 | 0.02 | -1.0 | 0.0 | -1% | 268 |
| 13 | -1.31 | -0.03 | -0.11 | -0.13 | -0.5 | 0.3 | 6% | 82 |
| 14 | 0.55 | -0.01 | 0.00 | 0.25 | -8.5 | -0.3 | -23% | 22 |
| 15 | 0.08 | -0.11 | -0.05 | 0.01 | 3.5 | 1.0 | -3% | 40 |
| 16 | -1.04 | 0.04 | 0.00 | -0.07 | 2.0 | 0.3 | 8% | 133 |
| 17 | 0.16 | 0.16 | 0.00 | 0.11 | 0.0 | 0.0 | -8% | 120 |
| 18 | -0.67 | 0.06 | 0.03 | -0.10 | 1.0 | 0.0 | 0% | 63 |
| 19 | -0.68 | -0.01 | -0.10 | -0.20 | -1.0 | 0.7 | 13% | 39 |
| 20 | -0.11 | 0.02 | -0.11 | -0.03 | 2.0 | 0.0 | 11% | 62 |
| 21 | 0.00 | 0.04 | 0.00 | 0.13 | 0.0 | 0.0 | -1% | 164 |
| 22 | 0.00 | -0.11 | -0.04 | 0.00 | 1.0 | 0.0 | 0% | 189 |
| 23 | 0.36 | -0.02 | -0.08 | 0.09 | 0.0 | 0.0 | 5% | 122 |
| 24 | 0.21 | -0.10 | 0.04 | 0.06 | 1.0 | 0.0 | -3% | 87 |
| 25 | 0.62 | 0.00 | 0.00 | -0.10 | -4.0 | 0.0 | 11% | 45 |
What a mess to dechyper. Here is a visual of just the median difference in ERA with the circle size being the number of samples.
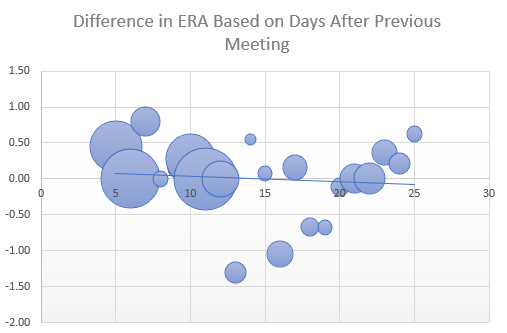
The clustering of samples can be seen with this image. Instead of grouping by individual days, I decided to create three groups and here are those results.
| Days Since Facing the Team | ERA | K/9 | BB/9 | H/9 | Pitches | IP | Win% |
|---|---|---|---|---|---|---|---|
| 5 to 9 | 0.25 | -0.01 | 0.01 | 0.07 | 0.31 | -0.01 | -0.93% |
| 10 to 14 | 0.03 | 0.00 | 0.00 | 0.01 | -0.30 | 0.01 | -2.09% |
| 15 to 25 | 0.08 | -0.02 | -0.02 | 0.03 | 0.21 | 0.00 | 1.32% |
The second table is a little easier to consume. A quarter-point jump in ERA is expected with the cause being from several other categories. After that first start, the ERA’s are just barely higher. The length the pitcher throws is unchanged with the pitches thrown being plus or minus a third of a pitch. Not an actionable change. The Win% does drop a bit but rebounds.
The results would support the narrative that the hitter would remember the pitcher if they recently faced them. Similar to times-through-order penalty. After 10 days or so, the hitter has faced enough other pitchers, the familiarity advantage disappears.
As for being an actionable occurrence, facing a recent repeat opponent seems to just be a tie-breaker to use when starting similarly valued pitchers. And after just one start between occurrences, any negative reputcutions effectively disappear.
Jeff, one of the authors of the fantasy baseball guide,The Process, writes for RotoGraphs, The Hardball Times, Rotowire, Baseball America, and BaseballHQ. He has been nominated for two SABR Analytics Research Award for Contemporary Analysis and won it in 2013 in tandem with Bill Petti. He has won four FSWA Awards including on for his Mining the News series. He's won Tout Wars three times, LABR twice, and got his first NFBC Main Event win in 2021. Follow him on Twitter @jeffwzimmerman.
Eyes on Skubal v. CWS tonight
I feel like I’ve had bad results on my sit/start decisions all season. CWS mash lefties (125 wRC+, .269/.345/.459), so I’m sitting him, which means he’ll probably get 10 k’s and a W.
This is an excellent example. Skubal is a different pitcher than he was in April. The Sox struggled to figure him out last week. Right now it looks as though Skubal figured something out. However, if the Sox light him up maybe the success he has obtained because of his adjustments are just short lived and easy to adjust to. But if he dominates again it may time to trade for him in your fantasy league before he becomes too expensive.
Thanks for tackling this. Been wondering about it for ages, ever since MLB got lazy with their scheduling a good decade ago.
I try and avoid starters (on the second start) if they are facing the same team in back to back outings.
Martin Perez’s last 2 starts. Blanked Houston for 7 and 2/3rds on the road, then lit up by Houston for 6 runs in 2 innings at home.
Great stuff as always. I’ve wondered the same thing and I tend to avoid risking it with mid tier sp
Good stuff. Wondering (1) does this include 2020 (when the schedule was super concentrated within the division) and (2) would it change if you added the postseason?
Is there reason to believe that pitchers will perform better the second time they see a team? I’ve noticed that some pitchers will improve upon a bad performance if they see a team within the next start or two. The pitcher’s familiarity with the team and ability to adjust their approach may be an asset to them as well.
My recollection is this has been researched before and there is not much difference and if anything pitchers perform better the 2nd time
EDIT***
Piece from 2013: https://www.beyondtheboxscore.com/2013/7/12/4515298/back-to-back-when-starters-face-the-same-team-twice-in-a-row-sabermetrics
Not much difference from one start to the next except that K’s drop very slightly.
ALso, I would think that the averages would be useful. Yes a bad start with 8 runs in 0.2 IP skews the average, but that bad start could be in either start and should wash out over a large enough sample (& if it doesn’t wash out that would be interesting as well)
Snell against the Mets will test this theory as well
DeGrom vs Padres in the same game will probably NOT test this theory
Not to add to the complexity of your research but I think a major factor is the experience of the SP. For example Luis Castillo faced Milwaukee on May 23rd. They didn’t really learn much if any because they have faced him so many times in the past. He gave up 5 runs in 5 innings. Yesterday he gave up 3 runs in 5.2 innings (he would have given up 1 run except the Reds have the worst bullpen in the history of baseball).
Conversely, James Kaprielian faced Seattle on May 26th. He gave up 2 hits and 0 ER in 7 IP. He faced them again on May 31st and gave up 5 hits and 4 ER in 3.2 IP. This did not surprise me at all. I think if you take out pitchers with less than 2 years of experience the results may be a bit different.
If I incorporate this strategy into my analysis without taking into account that you include all pitchers I may miss out on good outings from mid-tier SP.
Mike Minor:
May 09 vs. CWS: 5 IP, 5 ER, 4 Hits, 2 BB, 7 K
May 15 vs. CWS: 7 IP, 1 ER, 2 Hits, 2 BB, 7 K