Has Ricky Nolasco’s Luck Finally Turned?

Ricky Nolasco has a career FIP of 3.81. Ricky Nolasco has a career ERA of 4.44. If the season ended today, it would be the second time he’d ever shown an ERA under four. Given his skill set (good strikeout rate for a starter, excellent control) and home park (both versions of Miami’s home park were pitcher-friendly), it’s a bit surprising. But since that breakout second, full season in 2008, Nolasco has frustrated his owners. Now that he’s finally on the move to Los Angeles, which boasts a pitcher’s park, but also a better team, are all systems go? What about the fact that ERA becomes a better tool when you’re talking about 1000-inning samples? Is Nolasco somehow fatally flawed?
First we should check if anything has changed recently. Because, though his FIP has remained in the mid-to-high threes, his xFIP and SIERA both crossed over into the fours last year. And there were metrics that suffered the last two years — his swinging strike rate dropped from double-digits to league average — even as some looked slightly better — career-highs in ground ball rates led to career-lows in home run rates. This year, his ground-ball rate has settled in the middle, his strikeout rate has returned, and his home run rate has remained below one per game. Perhaps he’s just found the right mix of grounders and strikeouts?
On some level, the choice between ground balls and strikeouts is about where you put the ball in the zone. In general terms, pitches low in the zone get grounders, and pitches high in the zone get whiffs (and homers). Not surprisingly for a guy that has had a good strikeout rate and suffered home run issues, Nolasco’s fastball has lived high in the zone, generally. Sometimes looking at heat maps becomes a tea-leaf-reading exercise, but let’s put the heat maps for his fastball against right-handers in 2011, 2012 and 2013 next to each other:


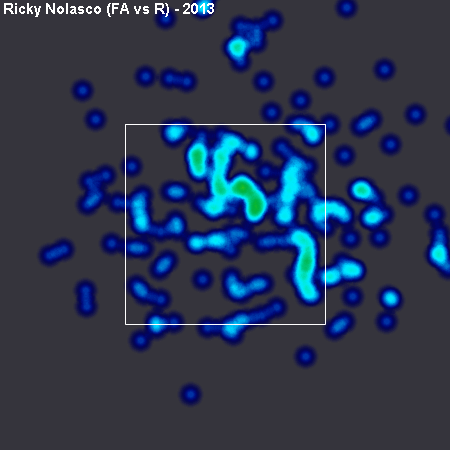
I see some experimentation. At least compared to his other years, 2011 shows more low fastballs than any other year. And if we’re looking for evidence that has led to a good mix of grounders and strikeouts, I wonder if it isn’t that sliver low and inside in 2013. That hot spot hasn’t been hot since… 2008 really. Hitting the inside corner on righties like that might help create useful ground-balls, and also strikeouts that don’t risk home runs.
So, although his pitching mix is largely unchanged from last season (still throwing two fastballs with a curve, split-change and slider), and his pitches are moving about the same (maybe he’s lost a little vertical drop on the splitter), there is some evidence that Nolasco has changed some of his approach. He’s been throwing the fastball low and inside to righties more this year, and he’s been throwing the four-seam a lot less in two-strike counts (down to 15% vs RHB and 24% vs LHB from 20 and 29% respectively last season according to BrooksBaseball.net). That’s a good way to help augment strikeouts and ground-balls at the same time.
And yet… It’s still Ricky Nolasco, and he’s been this way forever. Why would he be different this year?
Let’s take a look at some comps, since there are other pitchers that have had bad luck on the batted ball for a long stretch. The first requirement is that they have shown a BABIP worse than .305 over qualified seasons since 2006, when Nolasco debuted. (Nolasco’s career BABIP is .308). But we don’t want just the scrubs — Nolasco’s career walk rate is 2.1 per nine, so let’s get all the pitchers that have had a walk rate under three per nine. And though Nolasco has had some okay ground-ball years, it would be folly to put him next to a group of worm-burners, so let’s limit the group to pitchers that had a ground-ball rate under 48%. Lastly, though Nolasco has been somewhat unlucky on homers and bad strand rates on a yearly level, he hasn’t at the career level (10.5% career home run per fly ball rate, average hovers around 10%; 68.7% strand rate, average is about 70% most years). So let’s limit the pitchers to those that have had a strand rate under 71%, and an HR/FB under 11%. Voila:
| Name | W | IP | K/9 | BB/9 | HR/9 | BABIP | LOB% | GB% | HR/FB | ERA | FIP |
|---|---|---|---|---|---|---|---|---|---|---|---|
| Andy Sonnanstine | 26 | 454.1 | 5.72 | 2.26 | 1.31 | 0.307 | 64.4% | 41.7% | 10.8% | 5.43 | 4.61 |
| Matt Morris | 20 | 428.2 | 4.79 | 2.75 | 0.97 | 0.307 | 64.0% | 46.4% | 9.5% | 5.19 | 4.61 |
| Jason Hammel | 46 | 863.1 | 6.59 | 2.99 | 1.04 | 0.311 | 68.5% | 45.7% | 10.8% | 4.88 | 4.25 |
| Jeff Francis | 52 | 1008.1 | 5.82 | 2.52 | 1.07 | 0.309 | 69.3% | 46.1% | 10.4% | 4.78 | 4.33 |
| Paul Byrd | 37 | 582.1 | 4.14 | 1.72 | 1.34 | 0.307 | 69.6% | 37.4% | 10.2% | 4.74 | 4.86 |
| Kevin Millwood | 62 | 1161 | 6.22 | 2.86 | 1.07 | 0.314 | 70.3% | 42.6% | 10.2% | 4.58 | 4.34 |
| Carl Pavano | 47 | 751 | 5.01 | 1.63 | 1.05 | 0.306 | 67.7% | 47.6% | 10.2% | 4.57 | 4.13 |
| Brian Duensing | 23 | 346.2 | 5.92 | 2.49 | 1.09 | 0.317 | 68.8% | 46.0% | 10.5% | 4.57 | 4.18 |
| Joe Blanton | 73 | 1321 | 6.37 | 2.23 | 1.1 | 0.311 | 70.0% | 44.3% | 10.7% | 4.54 | 4.12 |
| Brad Penny | 63 | 901 | 5.51 | 2.89 | 0.9 | 0.308 | 70.2% | 47.2% | 9.1% | 4.45 | 4.26 |
| Ricky Nolasco | 79 | 1198.1 | 7.37 | 2.08 | 1.09 | 0.308 | 68.7% | 41.6% | 10.6% | 4.45 | 3.81 |
Look at that. Among his peers, defined by his unique mix of stats, Ricky Nolasco actually has had the best ERA since 2006. And FIP. But you might notice that almost all of this group had worse ERA than FIPs over this stretch, too.
Is there anything you can say about this group as a whole? For one, it’s not a great group of pitchers. And they mostly throw bad fastballs. The average fastball velocity for this group over the sample was 89.5 mph. Their average swinging strike rate was 7.4%, also decidedly below average. Since 2006, the group has produced two or three usable fantasy seasons.
At least Nolasco is slightly better than this group of co-horts. His fastball velocity is a mile per hour faster, and his swinging strike rate is above average. But since he belongs in this group, it’s fair to ask why he’s the only one that has managed to strike out more than seven per nine, and yet has still allowed more balls into play than he should. A quick look at his pitch-type values shows that his fastball is his worst pitch by that stat, and since the rest of the group has shown bad fastballs, that might be the most revealing aspect of the comparison.
As an older pitcher, Nolasco’s fastball isn’t going to get any better. But by placing it in the right place and using it less often, Nolasco is having the best season of his career. There’s evidence that he’s changed his position on the mound and it’s helped against lefties, too. Dodger Stadium isn’t likely to suppress as many home runs as that park in Florida, but anemic as that Dodger lineup has been, they’ve scored 50 more runs than the Marlins’, and they’ve been getting healthier recently. Then again, the Dodgers defense is 23rd in the league by UZR/150, and overall a negative, while the Marlins actually have been positive as a group.
For every reason to believe that Nolasco will, for the second time of his career, show a BABIP under .300 and an ERA under four, there are a couple reasons to believe he will continue being who he has been for 1225.2 innings so far in his career: a guy that won’t hurt in you strikeout rate or WHIP, but whose ERA and home run rates mean you should start him only when the matchup favors him and he’s in a pitcher’s park.
With a phone full of pictures of pitchers' fingers, strange beers, and his two toddler sons, Eno Sarris can be found at the ballpark or a brewery most days. Read him here, writing about the A's or Giants at The Athletic, or about beer at October. Follow him on Twitter @enosarris if you can handle the sandwiches and inanity.
That is a really interesting group of comps you’ve turned up. It seems like there are certain packages of skills where we can consistently expect a pitcher who fits the criteria to underperform his projected ERA metrics.
Bad fastball, good control, it seems. Fringe.
So … Twins pitchers.
This looks like classic overfitting to me. By defining the group as pitchers with average or worse strand rates, you’ve ensured that the group will underperform their ERA predictors.
What’s the y-t-y correlation on strand rate? If it’s low, then it’s possible (likely?) what’s been captured here is a group of pitchers that were unlucky with regards to bullpen support/clumping/BABIP and thus allowed a higher percentage of runners on base to score.
Remove all the other controls, and just look at pitchers with sub 71% strand rates, and I’d be stunned if you didn’t have a similar result.
There’s a reason strand rate isn’t an input into xFIP/SIERA.
you’re right, it’s pretty bad http://www.fangraphs.com/blogs/basic-pitching-metric-correlation-1955-2012-2002-2012/
but I thought I might avoid some of that with the large samples. Other than Sonnanstine and Morris, though, these guys all had luck-neutral LOB%s mostly.
I don’t think it’s the main clustering factor here, I think it’s the high BABIP with good control and bad fastballs.
The velocity thing doesn’t quite add up however. There’s basically no correlation between fastball velocity and BABIP overall (R^2 of 0.0023 last year for instance).
But it might not necessarily be it’s velocity, but just how good the fastball is. For example, maybe it is very straight and gets hit easy, or the way the pitcher pitches leaves it in ideal hitting spots more? (IE These pitchers may have high control, but poor fastball command)