FAAB Spending Comparison in 12 and 15-Team Leagues
Today’s data dump is brought to you by Paul Sporer and Justin Mason. In a recent Sleeper and the Bust episode, they were frustrated with not knowing how bidding in a 12-team league compared to a 15-teamer. I decided to go ahead and dive into the bidding in the NFBC’s 12-team Online Championship and the 15-team Main Event.
Note: I worked on this article over the weekend and only had this season’s FAAB data up to week 10. By the time the article publishes, week 11 will be available. The results wouldn’t change much with one additional week.
First, here is some background information on the league types. They are exactly identical in these ways:
- 23 total starters, 9 pitchers, 14 hitters
- $1000 in FAAB to spend with no Vickrey bidding and the results run on Sunday evening.
- No $0 bids.
- Seven bench spots.
- Both have a league and overall prize.
As for the differences, one is obvious, one has 12 teams and the other 15 teams. The less obvious one is that the 12-team leagues, on average, start drafting earlier in the preseason. For this reason, MLB teams have more time to churn their rosters and deal with injuries making the first FAAB period a little more aggressive compared to the 15-team leagues.
With the background out of the way, I’ll start with the simple theoretical explanation of the bids. In the 15-teamers, the total amount of FAAB per league available to spend is $15000 ($1000×15) and $12000 for the other 12-teamers. Gory math time:
$12000/$15000 = 80%
In the 12 teamers, they have 20% fewer resources to spend so the price should be lower by 20%. That’s the theory but does it hold up? Yeah …. not really.
To test it out, I took all the players with ten or more bids in the 15-teamers and matched them up to the 12-team bids for that week. Then I compared the matched values three different ways and ended up with similar results.
- I added the matched bids (279 bids) for the 12-teamers and then for the 15-teamers. The ratio worked out that the 12 team total was 61% of the 15 team total.
- I found the ratio for each pair and then took the ratios’ median value. It was 59%
- I plotted the two values on a graph and found the best fit linear line. The ratio was 57%
Using the three ratios, the values work out to around 60%.
There is a disagreement between the theoretical answer and the actual answer. So how are the league different?
The fantasy community just went through FAAB-a-palooza a couple of weeks ago. Now, it’s time for graph-a-palooza. To show how the FAAB spending compares, here are the leagues’ spending differences. I have also included all the 2018 Main Event data for comparison.
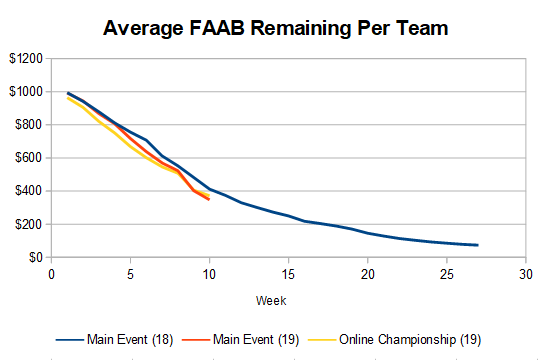


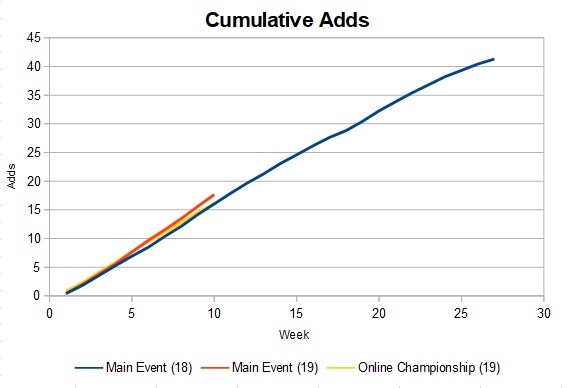
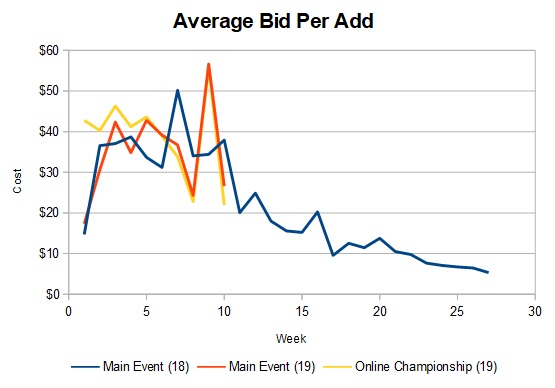
There is a lot to take in but it’s tough to explain the difference without all the graphs. The big takeaways are that:
- The overall spending is almost identical.
- The weekly spending is almost identical besides the first week.
- There are fewer moves in 12-team leagues.
- More FAAB is being spent, per player, in a 12-teamer.
They all combine to point to a fairly obvious conclusion, there are more and better players on the waiver wire in 12-team leagues. With a larger free agent pool, better players will get dropped or might not be owned until their breakout week. Many times while going through the data, I saw a player who was picked up for single digits in the 15-team leagues, have a good week, and then see their price jump for the 12-teamers. In 15-team leagues, owners are picking up players who may breakout. In 12-teamers, they are paying for the breakout.
Now, It would make sense that the 12 team low bids would lower than the 60% average and then the difference would lessen as the bids increased. A $10 bid in a 15 teamer could be $5 in a 12-teamer but a $5 add in a 15-teamer might not even be rostered in a 12-teamers. But this ideal difference doesn’t happen. Here are the average differences for various bid intervals.
| Avg Final Bid | 12 Team/15 Team% |
|---|---|
| >$100 | 57.3% |
| $50 to $100 | 50.5% |
| $25 to $50 | 55.4% |
| < $25 | 84.0% |
It’s at the lower bids is where 12-teamers spend the most compared to 15-teamers. On what should be a $1 player, 12-teamers may be bidding a little extra to guarantee rostering the player. This difference drops to around 50% until the wallet busters come out which push the values up to 60%. No wonder Paul and Justin were confused. I am right now and I have the data in front of me.
It’s not that those bidding in one of the two formats is “right”. It’s just that they’re different.
I’m sure there is a way to use the information to an advantage but it would probably involve examining the winning and next highest bid, especially at the lower bids. The preceding has been quite a bit of information to digest, but 12-teamers should expect to pay 40% to 50% less for comparable players in a 15-team league. Also, when it comes to near replacement level players, the difference shrinks to just 15%.
Jeff, one of the authors of the fantasy baseball guide,The Process, writes for RotoGraphs, The Hardball Times, Rotowire, Baseball America, and BaseballHQ. He has been nominated for two SABR Analytics Research Award for Contemporary Analysis and won it in 2013 in tandem with Bill Petti. He has won four FSWA Awards including on for his Mining the News series. He's won Tout Wars three times, LABR twice, and got his first NFBC Main Event win in 2021. Follow him on Twitter @jeffwzimmerman.
Would be nice to see graphs for $100 leagues. It’s not a straight 10% drop from the $1000 leagues.
If you have the information on some, let me know.