Does Draft Position Matter in Fantasy Baseball?
Introduction
Does it make a difference as to a fantasy baseball team’s starting draft position? Are all draft slots created equally? Is it better to be at the ends (wheel/turn), or rather, is it more opportune to make one’s selections from the middle of the order?
To try and help us answer these questions, let’s look at what happened in 2019. Now, of course, the current season isn’t over just yet – there are still a few more weeks of baseball. However, now in mid-September, it is sufficiently late in the season for us to analyze how the draft positions played out over the course of 2019.
Sources Used
For this study, we will observe the standings for three different league types:
- TGFBI – 21 Leagues
- NFBC Main Event – 38 Leagues
- NFBC Draft Champions – 230 Leagues
TGBFI (The Great Fantasy Baseball Invitational) is our own Justin Mason’s creation. It is a compilation of 315 fantasy baseball experts, divided into 21 NFBC-Style divisions. The 315 experts are also pitted against each other in a large overall competition. [I am the host of the TGFBI Beat the Shift Podcast, which can be found right here.]
The NFBC (National Fantasy Baseball Championship) Main Event is a set of high money entry leagues, with large financial payouts for the victors. As with TGFBI, the teams are all additionally entered into an overall contest with even larger payouts for the top finishers.
The NFBC Draft Champion leagues are money league contests as well (although their cost and payouts are far less than that of the main event leagues). As I will further describe below, they are 50-round slow drafts.
The nice thing about using NFBC data is that all leagues have the identical setup as far as active roster/lineup constraints and scoring categories go. Mike Trout theoretically provides owners with the very same benefit in each of the league types. Furthermore, all leagues in this study institute an “overall” component. All three formats do not allow for in-season trading, all are standard 5×5 mixed leagues, and all are 15-team deep.
There are of course a few league differences worth noting. The first is their mode and time of draft. Both TGFBI leagues and NFBC Draft Champion leagues are slow drafts. Each team is given a 4-hour clock per selection, and the draft runs over multiple weeks. Some NFBC Draft Champion leagues started all the way back in January, while some took place in February and/or March. NFBC Main event leagues are traditional snake draft leagues. They allow for a 1-minute maximum time limit per selection, with most league drafts taking place in March.
One other major difference between the three leagues is the use of the waiver wire. Draft Champion leagues do not allow for in-season pickups, and therefore draft a much larger roster of players (50 players per team). TGFBI and the NFBC Main Event are each restricted to 30-man rosters, but allow waiver claims via FAAB during the season.
TGFBI and NFBC Main Event Leagues
Let’s start by looking at where the current league leading teams emanated from in TGFBI and in the NFBC Main Event.
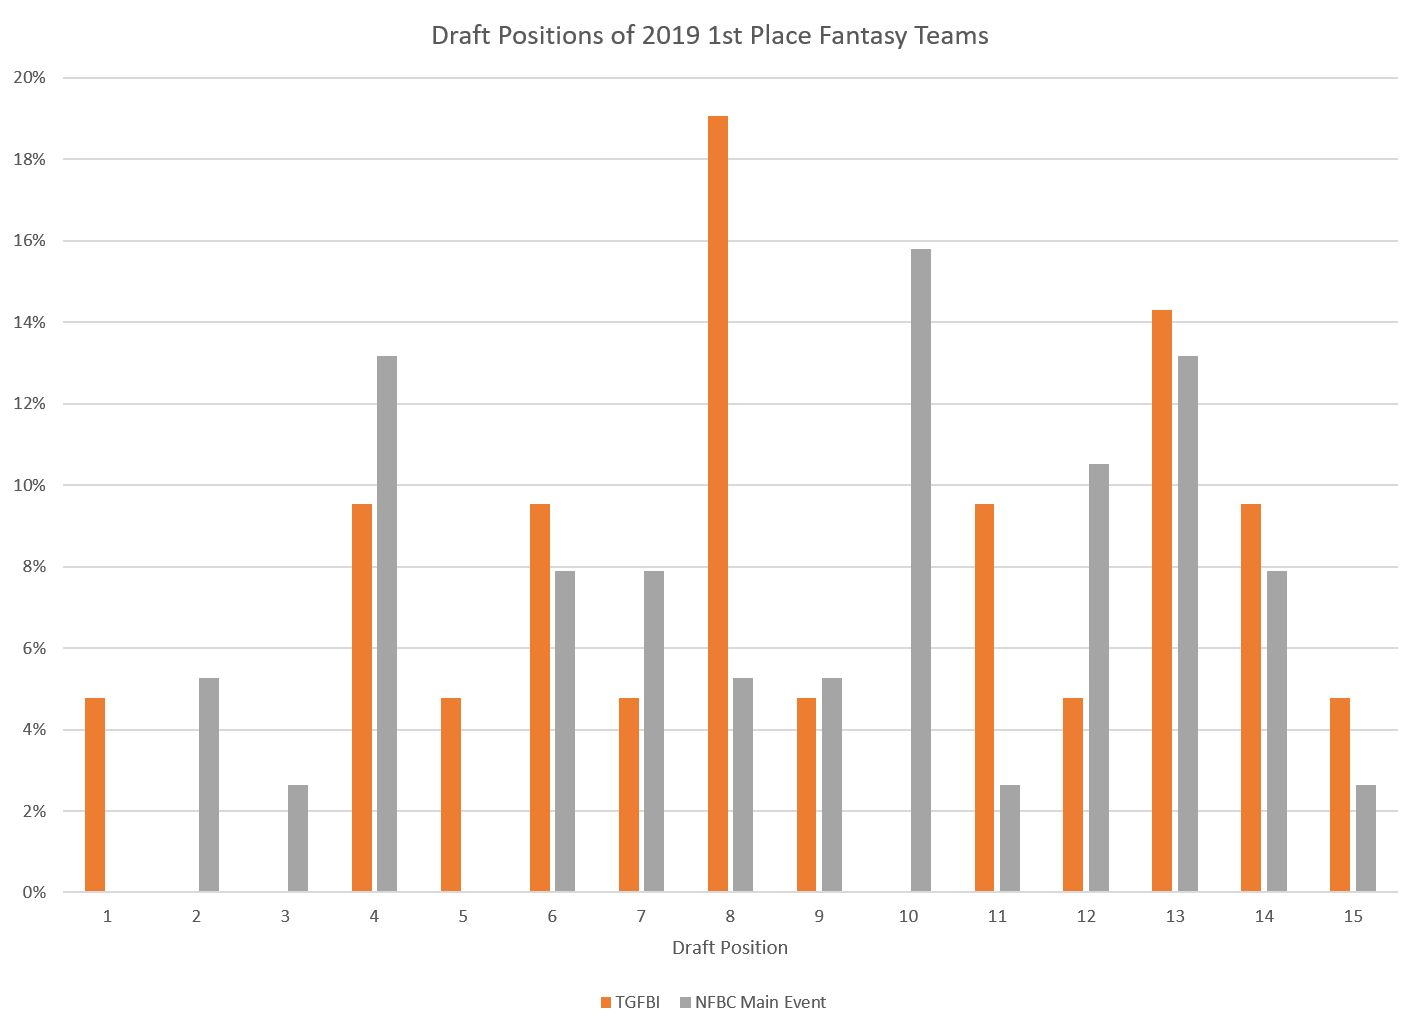
The above graph displays the percentage of league leading teams according to their initial draft position. The average figure, if all draft slots were created equal would be 6.7%, or 1 in 15.
TGFBI drafters from the first 3 slots did not fare well in terms of leading their leagues. Only 5% of first place teams came from slots #1-3, which is about one-fourth of the average figure. NFBC Main Event teams fared slightly better but are still below half of the expected average.
Across the two formats, the 13th slot was the one that fared the best, accounting for 14% of league leading teams – about double the expected rate. Slot #4 also faired quite well for both TGFBI and NFBC Main Event players.

Simply looking at 1st place teams may not give us enough evidence of how the draft slots fared. To further aid us, above are the current results for “Money Finish” fantasy teams. I use the term “Money Finish” to denote a top three team in leagues.
One additional note. For clarity – the percentages listed in the graph add up to 100%, and not to 300%. The percentages here refer to number of teams divided by the total number of top three teams (instead of by the number of leagues).
The first three slots (#1-3) once again performed quite poorly for both formats, especially for TGBFI. For the NFBC Main Event, teams were about half as likely to finish in the money drafting from the first 3 slots, as compared to average.
Slots #7-9 performed quite well. In TGFBI, 29% of top-3 teams emanated from these middle draft slots – about 50% better than expected. For the main event, the #7-10 slots were the prime area to draft from.
NFBC Draft Champion Leagues
Now onto the NFBC Draft Champions. With 230 leagues (a larger sample size), the DC league results should be less prone to random fluctuations than the TGFBI / Main Event results.

For first place teams, the #1 and #14 slots were the worst two positions to draft from. The two combined for just a 7.4% share of the leading teams – about half of expected. The #3 and #15 slots were the following two underperforming draft positions. It seems that the end positions of the draft champion leagues were not favorable. The #10 slot was the clear place to be with nearly 11% of all leading teams starting from the 10th position.
The “money finish” results are a bit more stable and depicts the same story. Teams from the #5 through the #10 slots were the most favorable, whereas the endpoints (#1-3 & #14-15) were the least favorable.
All Three Formats
Let’s now accumulate all the various leagues together and take a closer look at the money finish teams across all three formats:

The above data now originates from 289 leagues, and from a combined 867 teams – which should provide a large sample size. Most of the leagues are that of the Draft Champion style; the other formats provide some smoothing.
It isn’t hard to visually see that the bars are low on the ends and are higher in the middle. The resulting difference between slot ranges (middle vs end) is significant and meaningful. For example, the average percentage from the six end slots (#1-3, #13-15) was 5.8%, versus 7.4% for the middle seven slots (#5-11). That’s a 28% difference – a 28% advantage for making player selections in the middle of drafts.
The analysis thus far has only showed the standings at the top of leagues – leaders and money finishers. Let’s now also look at the bottom of the standings.

Above are the results of teams currently in the bottom three of league standings, displayed by originating draft position. What is interesting in the above, is twofold.
One, the distribution of the “bottom three” teams is far less volatile than that of the “money finishers.” That is, there is far less of an importance between draft slots for teams at the bottom, than there is for teams at the top.
Second, the chart is NOT the mirror image of the “money finish” chart. For example, the #10 slot which led to the largest number of “money finish” teams – also led to the most “bottom three” teams. The #10 slot was apparently highly variable in 2019 – either it was a highly profitable team, or a complete disaster.
Slots #1 & #2 were the two worst slots to draft from, with slots #3, #14-15 closely behind. The general trend that we saw earlier still continues.
Conclusions
The above analysis only looks at one year of data, and only at a few limited formats hosted by the NFBC. It is entirely possible that other fantasy formats would behave differently. Of course, it is also difficult to generalize and make conclusions about draft positions on a going forward basis from just the one year.
But since dynamics don’t often change dramatically from year to year, this is an excellent starting point. We must start somewhere. The results from 2019 are significant enough to form a conclusion on the current year. Those who drafted in the middle of the draft order were at an advantage over teams drafting from an end slot. The advantage was on the order of around nearly 25%, which is not small.
It is difficult to pinpoint and explain the cause of this result, as there a few possible reasons for the empirical advantage. Though one impetus may be that players selected near the endpoints in 2019 contained many of the large underperformers – I will offer up my own alternative conjecture as to the cause.
In many ways, draft management and maintaining team balance is easier and is more effective from a middle draft slot. Fantasy owners near the endpoints this season likely selected players earlier than they should have, given their expected projections. Owners pushed up speedsters such as Dee Gordon and Mallex Smith in fear of losing out on obtaining stolen bases. Closers may have been taken a round early in fear of losing out on a run of stoppers, etc.
Endpoint drafting teams have long durations between selections. Because of the fear of losing out on needed or wanted players – those teams may have over drafted players and were less able to take advantage of bargains more present for middle slot drafters.
One other thought. At the very top of the draft (#1-3 slots), values do not spike as high as in fantasy football. In football, having a top 3 overall pick is a large advantage. By my valuation, the #3 overall pick this season (a high end running back) was worth $85 in an auction as compared to the #7 overall pick worth $60. That’s over a 40% difference. In baseball, the difference between the #3 and #7 picks may be closer to only 15%.
What will your draft slot preference be in 2020? Will it be #7 in a 15-team league, or will it still be #1?
Ariel is the 2019 FSWA Baseball Writer of the Year. Ariel is also the winner of the 2020 FSWA Baseball Article of the Year award. He is the creator of the ATC (Average Total Cost) Projection System. Ariel was ranked by FantasyPros as the #1 fantasy baseball expert in 2019. His ATC Projections were ranked as the #1 most accurate projection system over the past three years (2019-2021). Ariel also writes for CBS Sports, SportsLine, RotoBaller, and is the host of the Beat the Shift Podcast (@Beat_Shift_Pod). Ariel is a member of the inaugural Tout Wars Draft & Hold league, a member of the inaugural Mixed LABR Auction league and plays high stakes contests in the NFBC. Ariel is the 2020 Tout Wars Head to Head League Champion. Ariel Cohen is a fellow of the Casualty Actuarial Society (CAS) and the Society of Actuaries (SOA). He is a Vice President of Risk Management for a large international insurance and reinsurance company. Follow Ariel on Twitter at @ATCNY.
This is really good work!
I wonder if this means leagues should be exploring different ways of drafting?
Say, a wheel draft where every round is randomized but each team will draft the same numbers of times at each spot (1-15).
Or a modified snake where the #1 team doesn’t wait quite as long to draft again. Sort of a controlled, non-randomize wheel, where it is more like 1, 22, 35 instead of 1, 30, 31.
The question is whether or not it’s the #1 overall that matters (where one mistake potentially screws up your whole season) or the punishment of having to wait so long to draft your 2nd player in a snake draft.
Bid draft. Every owner bids on draft position in each round as it comes up
e.g. 10 owners x 25 man roster = 250 “dollars” to bid with.
Every player makes a silent auction bid before the first round. The highest bid gets first pick. Second highest bid gets second pick, etc… and the bid dollars are spent.
Second and subsequent rounds are each a new silent auction, but with smaller pools of dollars remaining each time.
If bids tie in the first round it’s resolved with a coin flip. If bids tie in later rounds then picks are ordered amongst the ties in reverse order of the previous round.
The first owner to spend their entire allotment gets the last pick in every successive round. The next player to run out gets the 9th pick. If two owners run out in the same round, they order in reverse of their 1st round picks.
For keeper leagues, instead of trading draft picks you can trade draft pool dollars.
I really like this idea a lot. And not nearly as complicated as my idea of a wheel draft.
Disclaimer: This question is 100% serious, and not all meant to be a “us auction folks are so much more hardcore (read: better and smarter) than you draft people!” critique.
Why do draft leagues still exist? Now that mainstream sites (as far as I know) support online auctions, does anyone actually prefer a draft? Are drafts just for people who aren’t serious enough and/or don’t have the attention span to be involved in the bidding on every single player (I doubt it, given that Fangraphs is writing about them).
Do some players see it as a negative that they have so much more flexibility in constructing their rosters in an auction league (e.g. stars and scrubs with, say, 5 $40 players and the rest $1-$4, vs. a completely balanced roster with everyone around $12-14)? Is it a positive that the draft format imposes a rigid structure to the roster? Is it bad to have the ability to acquire *any* player you want at the start of the season (and realistically, actually 3 or 4 of these players), provided you’re willing to pay up?
Or is it a chicken/egg thing, where people join draft leagues because a lot of writing/rankings are based on drafts, and a lot of the writing/rankings are based on drafts because there are a lot of people in draft leagues? Do people just stay in draft leagues because that’s what they’ve always done?
Or am I’m just completely off base, and is the thought of an auction just too “geeky” for the majority of fantasy baseball players?
Like I said, all 100% serious questions, and no condescension at all is intended. If you’re reading Fangraphs, you’re in all likelihood intelligent and a pretty serious baseball fan – so if you prefer drafts to auctions, what are the reasons?
Some of it has to be that auction drafts take a lot longer, right?
I’m not sure – do they? I guess it depends on the settings for time limits on picks and everything, but I think my (CBS) league is something like 30 seconds to nominate a player, and then 10 seconds without any further bids for a player to be sold. Most players get bid up to close to the selling price very quickly, and then there’s a few slower bids at the end (and I’d argue that’s most exciting part!). I’d estimate the average player takes maybe ~80 seconds. But then once you’re at the end, most go for $1-$3, and those are all under a minute.
How long do teams have to pick in a draft league? If it’s a minute, then the overall length is probably pretty similar (assuming the same number of players, of course).
Auction drafts with minimum time allowances typically still take 2X the length of a same-sized snake draft.
Also, I never really understood why “getting it over with” faster is so important (to be fair, there are guys in my auction leagues that feel this way too). I get that there are family commitments and stuff, and a 6 or 8 hour long thing would be way too long – but this is literally the most exciting day of the season – why the rush? Personally, I’d prefer it lasted a little longer (within reason, of course).
Love the downvotes with no responses (save for dl80, with a reasonable one) to a serious question!
Some/many people are bad with money, and they may not be interested in economic game theory. Auctions can be intimidating, and they are a completely different strategy. Similarly some people prefer the game Uno to Twilight Imperium.
There are distinct opportunities for collusion in auction leagues that are not available in draft leagues. I won’t get into all the specifics, but having a coalition of teams wasting their auction budget artificially increasing the cost of some players while not increasing the cost of their colleague’s targets can have a serious impact on the results. When you are talking about significant cash payouts, the incentive is very much there.
Having helped to lead the charge over to auctions, I’ve come to appreciate the strengths of a snake draft: namely that they’re fairer to weaker fantasy players and form an better foundation for a balanced league. If owner talent is heavily asymmetric, adding the complexity of an auction rigs the game. Granted, a better owner is always a better owner, but it’s easier for a lesser owner to walk away from a snake draft with a solid team. It’s also more likely they’ll get lucky.
1-Year samples are kind of silly because everyone’s taking the same players at the top of the draft and so a case like JoRam will drive down performance of the top 3 picks. I still think Pick 1 is the best as the difference between Mike Trout and the second best player is larger than the 25th to the 26th player. Previous analysis over multi-year performance has confirmed this suspicion.
Also, I’m in 5 big money leagues for Fantasy Football and I have no idea where you’re getting those auction values. Even with inflation no one’s going above $70, with Saquon (#1) arguably worth about that. Whereas Trout for me has been a case of being worth well above anyone else even close to him.
That being said, I do agree that being in the middle of the draft allows for better values to fall in drafts, as the flexibility that comes with picking consistently and being able to scoop up guys with more “granularity” instead of 2 picks everyone 24 picks will help you overall.
Definitely sucks to be picking last, I still hold firm with the idea that you just want a linearly decreasing draft pick as the marginal difference between 1-2-3-4-5… is greater than pick 25-26-27-28…etc.
I’ve always wondered this quite frankly. I would think for baseball it might be a lot different than football or other sports- as depth matters a lot more than those other sports….
IMO the problem with drafting 1-3 or 13-15 is how long it takes inbetween your double picks. runs on positions can happen and you’re left sitting their with no option but to adjust. I like picking in the middle cause you’re always in the middle of the action
Interested in the poor performance of #1/2 picks. I presume this year those were often Trout/Betts, or in any year picking the best 5 tools player out there. Then, when they don’t get their SB, the 1/2 advantage is gone. Begs the question of how best to get SB.
Any chance you will discuss this at FPAZ?
I had a couple #1/2 picks and managed my SB total fine. What I didn’t anticipate was the crazy quantity of HR. Mallex Smith types (i.e. where I got my SBs) were flat-out unplayable in any multi-league format like TGFBI or NFBC.
I think if you chop 15% of home runs off the league total, removing them mostly from unanticipated power sources (rather than evenly), then you’d see the Trout owners doing a lot better. Basically, if the league behaved as it was expected to behave, then the results could be different.
In my experience in NFBC leagues, draft position generally only matters for the first 6-8 rounds. After that things widen enough (you could probably look at the min/max pick range and see this) that most drafters tend to just start picking the players they want. You might get more mileage by just looking at those early rounds (if that’s even possible) since that’s where draft position matters the most.
I dont have a preferred pick. It changes from season to season.
I basically just look at the guys who are 100% surefire studs (Trouts, Mookies, Freeman’s etc.). If there are only 5 100% surefire studs, I dont want to pick 6th or later.