Choose Your September Pitcher (Venues) Wisely

As we’re in the final (final) stretch of the fantasy baseball season, the magnifying glass needed for every pitching start chosen needs to be that much larger. To continue our recent theme of looking at the ways to make wiser choices in these regards, I’d only intended on adding a little context about the offensive environments according to stadium park factors. But as often is the case, down the rabbit hole I tumbled. And as we’ll see shortly, one cannot simply look at park factors from a single angle, as multiple agents of chaos must be accounted for.
But first, what exactly are Park Factors? They’re provided by many sites (ours included), assigning a number (often on a scale where 100 is considered average) to many individual categories (R, HR, 1B, 2B, etc), as well as an “overall” park factor.
For example, Angel Stadium has a 121 park factor for HR in 2022 (three-year rolling average), according to Baseball Savant*. So, what does that mean? While any site that creates park factors likely has its own creational quirks (that I won’t attempt to guess at), the basic idea is that they’re taking the frequency of the chosen category (HR, in this case) at one park and comparing it to how the same population of hitters performed at every other stadium. A 121 HR factor is telling us that hitters had 21% more home runs at Angel Stadium than they did everywhere else. And the same can go for any other category.
*I like to look at a few different sets of park factors, as different sites provide their own set of categories and configurations. We’ll be using Savant’s factors today but that’s just because we don’t yet have factors for 2022 here at FanGraphs. And I also like to check in on the factors provided by EV Analytics, (which include BABIP and wOBA) but won’t today because they aren’t split by handedness (which we’ll be looking at later).
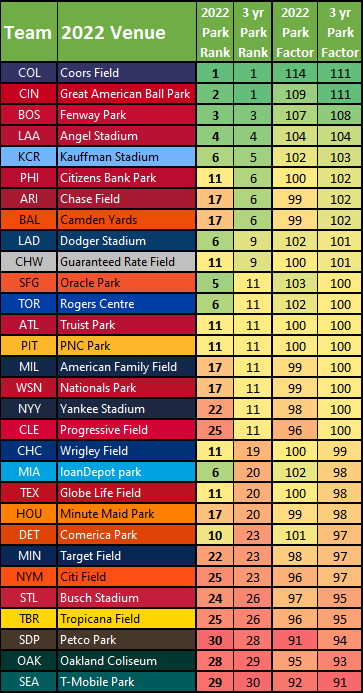
With definitions out of the way, let’s get some factors. But which ones should you use? Savant has options for single years and three-year rolling averages, while a five-year average is also included here at FanGraphs. We all know about the chaos that can be wrought by a one-year sample, so clearly, we should start with the three-year sample.

Ok, that’s a pretty good-looking list and with Colorado in first, it also passes our initial check of: “Does it Coors?”. Since it does (also including Cincinnati as a hitter’s haven, and listing Seattle, Oakland, and San Diego as the reverse), these factors seem reasonable. We’ll be moving on to other charts but for consistency’s sake, I’m going to keep this team order throughout.
But are they really helping us? A few teams are clearly “hitter parks” and a few are clearly “pitcher parks”. And then there are a whole mess of teams that are close to average, on one side or the other. That’s not super helpful.
But also, Kaufmann is a hitter’s park? And shouldn’t Detroit be worse? What about the changes in Baltimore? And therein lies the problem with multi-year park factors in this particular year of our Shohei, two-thousand twenty-two.
Can anyone think of the aforementioned agents of chaos that may have been roaming about from 2020 until now and that might have had a large effect on any three-year sample? Well…
The 2020 Season
I don’t know if it feels like a million years ago to you too but remember that whole shortened season in a global pandemic thing from a couple of years ago? Crazy, right? Well, if you think shenanigans are possible in a one-year sample, imagine the possible extremes in a 60-game season. Not to mention that Toronto didn’t even play in Toronto. Eee-vil shenanigans.
Universal Humidors
More like all new-midors, am I right? Once there was only one, and then two, after Arizona joined the Coors club in 2017. And if you remember the launching pad that Chase used to be, it’s easy to quantify the effect. But in 2020-2021, a new influx arrived, with humidors quietly being installed by the Red Sox, Mariners, Mets, Cardinals, Astros, Marlins, and Rangers. And in 2022, we went universal, with all parks now using humidors to bring all baseballs to an average humidity, making balls more humid (and heavier) in dry environments, and conversely lighter in humid environments. But while the humidors are now universal, their effects are not, particularly since 2022 is the only season in our three-year sample in which they were.
Baseball Changes
RIP Happyfunball, all hail ball of the dead. The baseball switchery being perpetrated by Rob Manfred and his merry band of pranksters would be bad enough if it had been applied consistently. But some balls were used for part of 2021 and different ones were used for the rest. And one type was used in 2022? Or maybe two? It’s all very confusing.
Physical Park Changes
Baltimore made massive changes to Camden Yards in 2022, pulling the left field wall in and raising it way up. The changes to offensive performance were just as massive, rendering their park factors from 2020-21 mostly useless.
Ok, so with all of the chaos reigning in a three-year sample, we should probably compare them to what has happened in just 2022:
Ok, that answers the Baltimore question, at least, with the new dimensions at Camden Yards ranking 17th in 2022, compared to 6th for the three-year average. This makes sense to anyone who has watched many Orioles games this season. But besides a handful of larger differences, we’re still not pulling very much actionable information.
To do that, we need to chop things up a little further. There are lots of ways to do so, given the breadth of catergories offered but lets focus on home runs. That way we can keep it simple but still split the differences of whether parks are good (or bad) for overall offense, power, or both.
Here are the overall park factors and home run factors for 2022 (by itself and as a three-year rolling average):
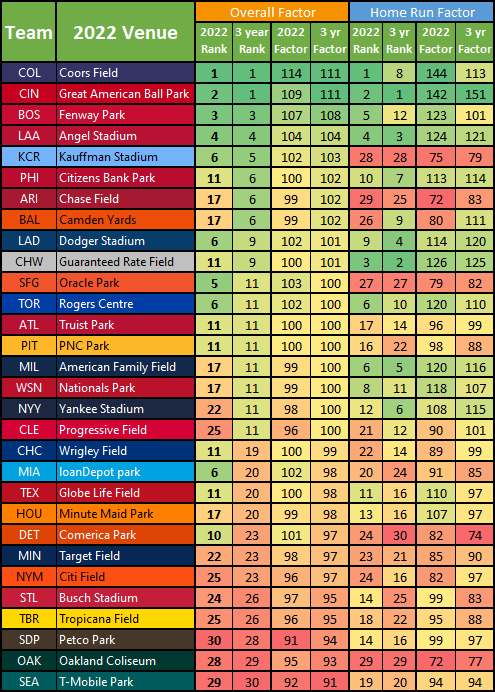
Ok, now some more interesting things are popping out. The change at Camden Yards is put into sharper focus, and Kaufmann Stadium is the power sink we knew it was, even with a top-five overall ranking.
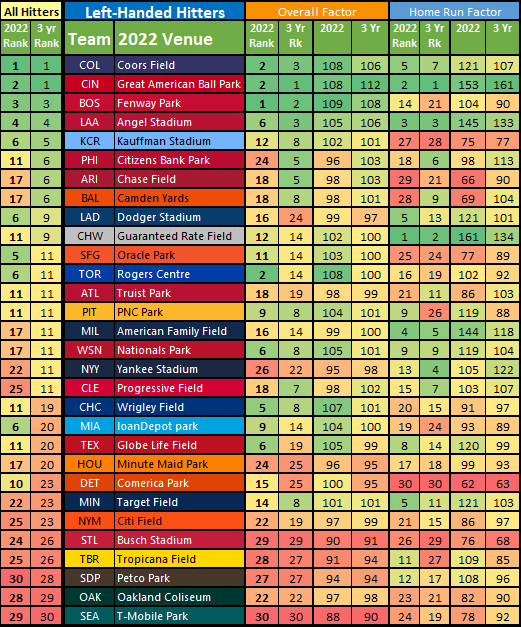
But we can go even further, right? Because depending on if you’re right- or left-handed, parks can play very, very differently. And you do know how much I love me some splits.
Here are the overall park and home run factors for left-handed hitters:
And for right-handed hitters:

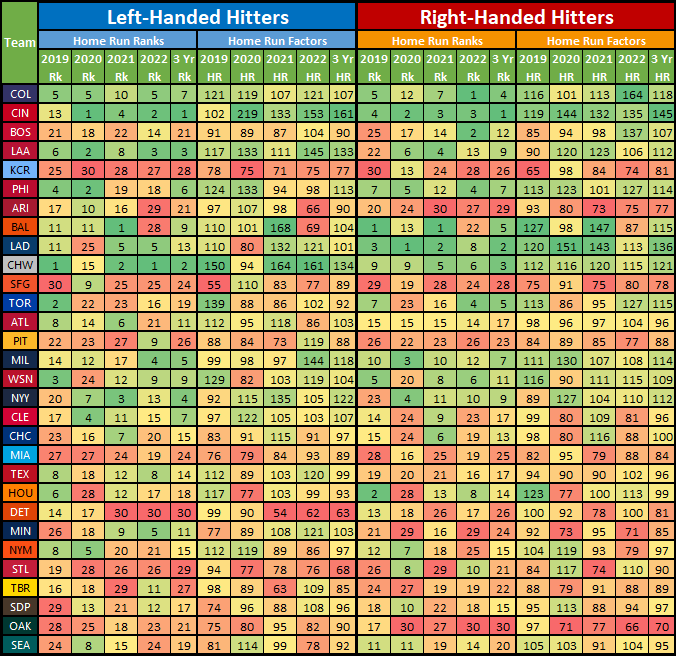
But just for fun – and to get more examples of small-sample silliness from 2020 – here are the home run factors for each hand from 2019-2022, along with the three-year factors:
Alright, that’s enough pictures. Let’s check in some notable things from around the stadium circuit, identifying weaknesses and strengths to better judge our starting options.
Yes, it can be as simple as avoiding the homer-happy venues but what hand a pitcher is, as well as what type (groundball, flyball, contact, etc) could also influence your decision. As can what categories (if any) you’re looking to focus on. Sure, homers are going to be depressed at Kauffman Stadium but what if you’re desperate for WHIP? In that case, I would be taking note that Kauffman might be a homer sink but is in the top five of overall park factors for a reason(s).
Let’s just jump in there.
Kansas City Royals, Kauffman Stadium
This is a great example of how parsing the overall park factors can lead to more illumination than what you get from a generalized idea. Kansas City is considered a pitcher’s park, in general, but a look at their overall ranks tells a different story, with Kauffman Stadium ranking sixth in 2022 and fifth for the three-year average. Huh?
Well, here’s the thing; Kansas City is a great hitting park – just as long as you don’t want to hit any home runs. No power for right-handers (28th for 3-year, 24th for 2022, 28th for 2021), and none for left-handers (28th for 3-year, never higher than 27th). But hits can be had.
Whether in single, doubles, triples, overall hits, or OBP, Kauffman posts factors in every recent season that are average to well above average for both hands of hitters. Particularly so in overall hits and singles – In 2022, Kauffman tied with Coors Field for both hands on the highest factor for singles, finishing second in hits for right-handers, and third (two points behind 1st) for left-handers. This is what we in the biz like to call, Slap-Hitty City, making it a good park for ERA but one of the worst for WHIP.
Colorado Rockies, Coors Field
We don’t need to spend much time talking about the type of offensive environment we’re dealing with at Coors Field. I just wanted to mention the monster power spike right-handers produced in 2022. Coors has a 164 HR factor for RHH in 2022 which is nearly 30-points higher than second and third place in Cincinnati/Boston and is about 50-points higher than Colorado has posted since 2019.
Cincinnati Reds, Great American Ball Park
Like Colorado, we really don’t need to break down the bandbox disguised as a ballpark in Cincinnati. But also like in Colorado, I just want to make note of an even more ridiculous power spike (219 HR factor) produced by left-handers in the shortened 2020 season. Seriously, 219? For comparison, the next highest HR factor for either hand since 2015 (because that’s when I stopped looking) was a 168 in 2021 for Baltimore right-handers.
Baltimore Orioles, Oriole Park at Camden Yards
Speaking of Baltimore, Camden is the home of our most obvious agent of change, with the left field wall moving in and up. The results have been palpable, so much as to render Baltimore’s three-year park ranks mostly useless. In 2021, both hands of hitters ranked first in HR factor. In 2022, right-handers ranked 22nd and left-handers ranked 28th. Be gone, bandbox…Be gone!
Boston Red Sox, Fenway Park
Fenway has always been a good park for overall offense but until 2022 had mostly posted power factors that were well below average. However, home runs were way up this season, especially for right-handers, who generated a 137 HR factor which is the highest at the park since a 122 HR factor in 2016, with no season in between reaching higher than a 101 HR factor. That tells me that 2022 is likely more of an outlier and wouldn’t start considering Fenway to be a plus park for righty power.
Chicago White Sox, Guaranteed Rate Field
Here’s a great example of small-sample shenanigans because Guaranteed Rate is the undisputed king of left-handed power, regardless of finishing with a 94 HR factor in 2020. But considering they finished first in 2019, second in 2021, and first in 2022, I’m confident in the legitimacy of their crown. And decidedly not confident in using a questionable right-hander with flyball tendencies.
Seattle Mariners, T-Mobile Park
While it’s up for left-handers in 2022, power in Seattle has often been surprisingly average, particularly for right-handers. But T-Mobile is where hits and runs go to die, with factors for both living at the bottom of the league. If ratios are your desired jam, Seattle is where you want to look but do be careful with suspect right-handers who have fly ball (and/or home run) tendencies.
Oakland Athletics, Oakland Coliseum
Chaos be damned because the Oakland Coliseum has remained one of baseball’s biggest offensive sinks, whether in regards to hits, power, or home runs. But Oakland is truly where power goes to die for right-handed hitters – the Coliseum has ranked 30th in HR factor for RHH in two of the past three years and is 30th in the 3-year ranks. Have a questionable left-hander you’re considering? Let ’em eat.
San Francisco Giants, Oracle Park
This is a similar situation as in Kansas City, with Oracle Park having a reputation as a pitcher’s park but only really doing a number on power while ranking above average in hits (and runs). And within that power suppression also lies another example of 2020 chaos, as Oracle finished 9th in HR factor for left-handers in the shortened season before going right back to the bottom-five rates that they’re used to.
Philadelphia Phillies, Citizens Bank Park
Philadelphia has played more average for hitters the past two seasons but most of the dip has come from drops in left-handed power. After a 124 HR factor in 2019 and a 133 HR factor in 2020, left-handers posted a 94 HR in 2021 and a 98 HR in 2022. I don’t know why.
Arizona Diamondbacks, Chase Field
We all know by now the effect that adding a humidor in 2017 has had on the offense in Arizona but power from the left side had stayed around average until this year when it cratered to 29th in HR factor. But this is another graveyard for right-handed power.
Detroit Tigers, Comerica Park
After being around average before, Comerica Park in 2021 and 2022 has been the killer of all left-handed power. Not that there is much more for right-handers but at least they have a pulse. Which, again, lefty power does not have at Comerica.
Seattle Mariners, T-Mobile Park
Seattle is consistently been where hits go to die but their HR factors have been surprisingly average, particularly for right-handed hitters.
Alright, that’s enough commentary from me. But please feel free to speak up in the comments about anything you find interesting, and/or want to mention any park dimension changes besides at Camden Yards (and Marlins Park a few years ago) that could be contributing to the chaos of 2022’s three-year sample.
But for now, let’s move on to:
**Bonus Charts**
Have a great week!
Nick, Hot in Playoff Season. Will the Rays continue to severely limit Jeffrey Springs innings going forward like they did in his last start with 3 IP? Have to decide whether to replace him in today’s waivers. Any info or guidance is appreciated.
It’s always hard to trust the Rays and pulling him after just 39 pitches seems worrisome. But I’m going to bet on this just being some one-game Tampa shenanigans and would keep Springs. Plus, even if they do start limiting him more, he’s set up for a two-start week that would help buffer it.
And thank you for reading!