Cold Right Now (CRN) is a weekly Ottoneu feature focused on players being dropped or who should be dropped in Ottoneu leagues. In this feature, we will break down players into three sections:
Roster Cuts: Analysis of players who have been cut in a high percentage of leagues.
Recent Injuries: A look at the implications of recent injuries (not all, just some high-profile ones).
Cold Performers: Players with a low P/G or P/IP in recent weeks.
This article will typically run once per week and will help fantasy managers keep track of players that need to be given extra attention to improve rosters.
The search for pitching help is never ending. Between injuries and ineffectiveness, fantasy players are always on the lookout for pitchers who are performing well who can provide some reinforcements. Hopefully, these six under-rostered pitchers — three starters and three relievers — can help.
Chad covered Ryan Gusto in his Hot Right Now column yesterday. I mostly agree with his assessment:
“So yes, he has looked good so far. But with only 22.2 IP so far this year, I am more inclined to bet on his track record than his early performance with Houston. Double his walks, double his HR, and how are you feeling? There’s nothing wrong with riding the hot streak. That could both net you some short-term gains and give you time to see if that control and HR suppression are legit. But there are other SP out there I am more interested in right now.”
One thing I’d like to add is that Stuff+ really likes Gusto. All three of his fastballs are above league average by that metric and so is his slider. Stuff+ isn’t as enamored with his changeup but that pitch is returning a 37.5% whiff rate which is above average for the pitch type. Sure, the minor league track record isn’t there, but it’s possible Gusto has taken a pretty significant step forward in his development.
I do need to advise some caution because of the contact quality issues Chad mentioned and also because the Astros will likely activate Lance McCullers Jr. from the IL within a few weeks and possibly Spencer Arrighetti a few more weeks after that. It’s very likely Gusto will be relegated to the bullpen once Houston’s starting rotation gets a little more healthy. So, yes, ride the hot hand while you can, but don’t expect Gusto to be a long-term solution for your pitching staff.
I recommended Jose Quintana in my last Ottoneu Drip and I’m honestly shocked he hasn’t been rostered more. All he’s done since that write up is make three fantastic starts, allowing just three runs total. His strikeout-to-walk ratio isn’t great and it seems like he’s relying on a lot of guile to get by, but the results speak for themselves.
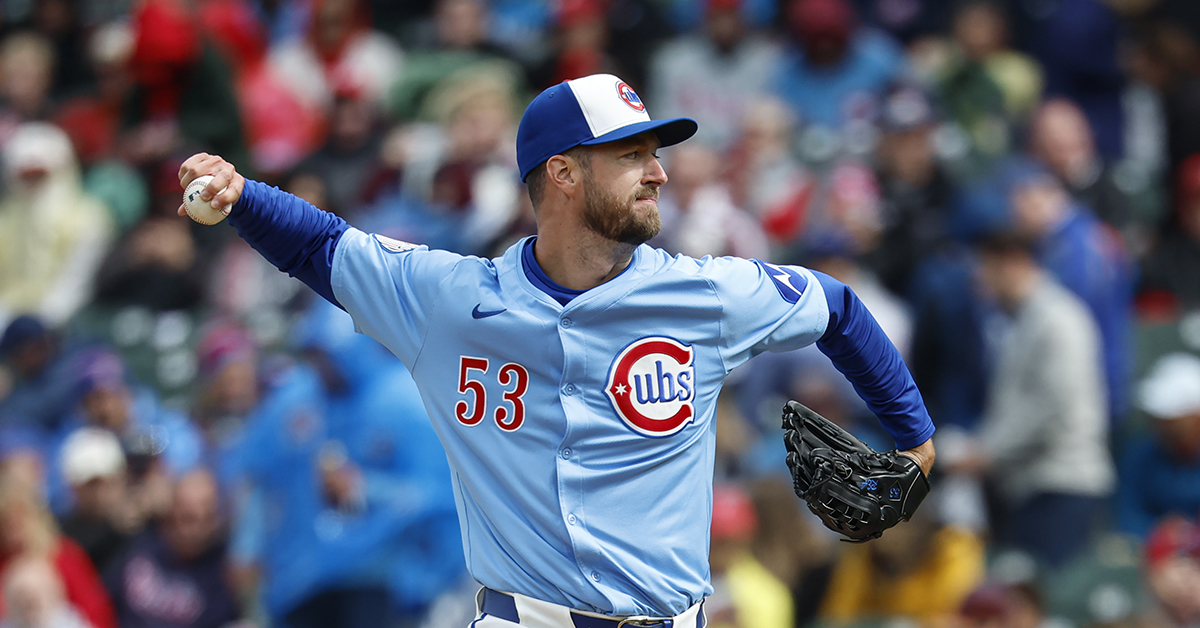
The injury to Justin Steele forced the Cubs to add Colin Rea to their starting rotation a few weeks ago. Rea muddled through the last two years as an innings eating member of the Brewers rotation, but he has made three solid starts for the Cubs against some really impressive opponents. Against the Dodgers, Diamondbacks, and Phillies, he’s allowed just two runs in 13.1 innings while striking out 17. That’s enough for me to take notice.
The biggest difference is a four-seam that he’s throwing more than half the time at the expense of his sinker. His repertoire is still deep — six pitches strong — but he’s really emphasized the heater. He’s throwing it about a tick harder than last year with a little more rise and a little more cut and it’s returning a 25% whiff rate and a .334 xwOBA, both above average marks for a four-seamer. He’s also dropped his arm angle by about five degrees which has had a positive effect on the horizontal movement of all of his pitches. The wide pitch mix, arm angle change, and an improved fastball makes him a pretty interesting pick up, though I might wait to see how he does in a few more starts before rushing out to add him.
Chad also covered Will Vest in his article yesterday and I don’t really have much more to add. If you’re speculating on saves in Detroit’s bullpen, Vest is as good an investment as any other high leverage option in that ‘pen.
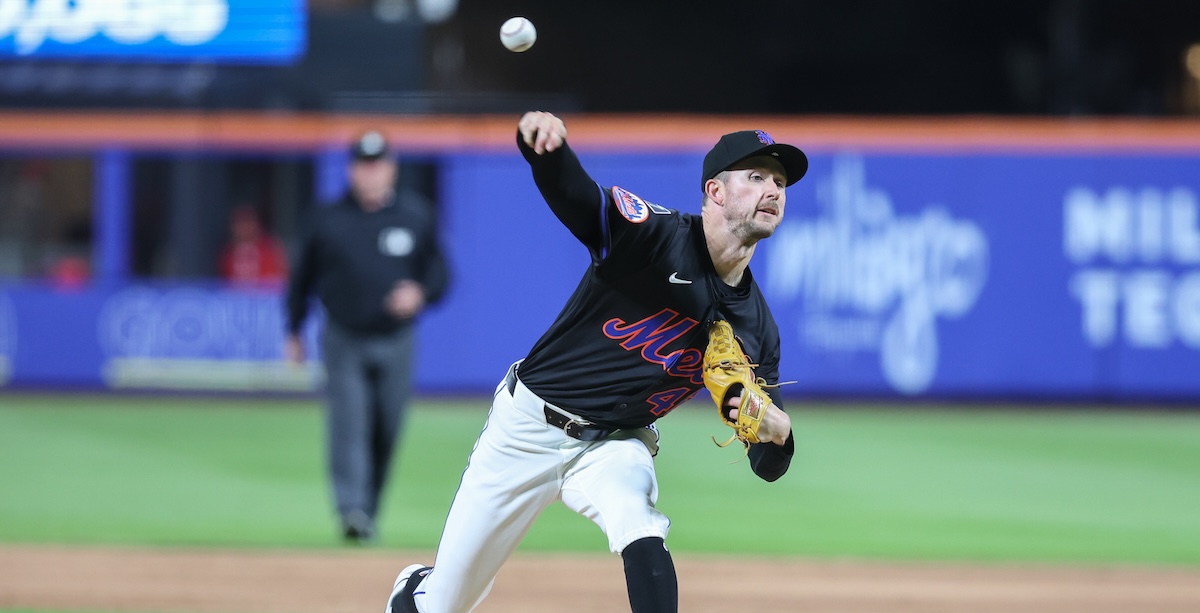
Reed Garrett had a mini-little breakout last summer before burning out in August. He’s still making high-leverage appearances for the Mets this year and he’s been pretty good. The strikeout rate isn’t as lofty as it was last year, but his walk rate is down and he’s only allowed a single unearned run.
Shelby Miller was finally healthy last year but his stint in Detroit’s bullpen of death could have gone better. He latched on with the Diamondbacks this year and is throwing a little harder and added a sweeper to his repertoire. He, too, has only allowed a single unearned run in 11 appearances for the Snakes and he’s already beginning to work some high leverage opportunities for them.
The 2025 version of Hot Right Now will typically include three sections:
Current Auctions: A closer look at players being auctioned at a high rate.
Roster Adds: Analysis of players with high add% changes.
Hot Performers: Players with a high P/G or P/IP in recent weeks.
The FanGraphs Ottoneu team plans to run this feature weekly, updating fantasy managers on the biggest movers in Ottoneu leagues with an analysis of how these players could or could not help your roster.
Welcome back to the Ottoneu Starting Pitching Planner. Based on the Roster Resource Probables Grid, I’ve organized every starter slated to start next week into four categories: start, maybe, risky, and sit. The first and last category are pretty self-explanatory. Starters who fall into the “maybe” category are guys you could start if you need to keep up with the innings pitched pace in points leagues or need to hit your games started cap in head-to-head leagues; they’re good bets to turn in a decent start, but you shouldn’t automatically insert them into your lineup. If you’ve fallen behind on the innings pitched pace or you’re really starving for starts in a head-to-head matchup, you could turn to a “risky” starter or two.
I’ve also calculated a “Matchup Score” for each series using a straight combination of opponent’s home/away wOBA, opponent wOBA over the last 14 days, and the park factor for the ballpark the teams are playing in. It’s indexed so that 100 is average and anything above that is a favorable matchup and anything below is unfavorable. That matchup rating informs some of the sit/start recommendations I’m making, though the quality of the pitcher definitely takes precedence. To start the season, I’ll be relying on projected team wOBA until there’s sufficient in-season data to start calculating these matchup ratings. I should also note that the two new minor league stadiums that the Athletics and Rays are playing in this year currently have neutral park factors in my calculations, though both should play like hitters parks (those series are marked in yellow below).
They’re not marked in red above, but I’d be weary of starting anyone from the Braves or Diamondbacks next week. Atlanta travels to Colorado which makes Chris Sale’s scheduled start a big risk and then the team returns home to host the Dodgers. Meanwhile, Arizona heads out on an East Coast road trip through New York and Philadelphia and neither Corbin Burnes or Zac Gallen have been all that impressive to start this season.
The Astros look to be the only team with a pair of easier matchups next week, at home against the Tigers and on the road against the White Sox. Ronel Blanco could be lined up for a double-start week but that could be in flux if Houston decides to activate Lance McCullers Jr. next weekend.
Cold Right Now (CRN) is a weekly Ottoneu feature focused on players being dropped or who should be dropped in Ottoneu leagues. In this feature we will break down players into three sections:
Roster Cuts: Analysis of players who have been cut in a high percentage of leagues.
Recent Injuries: A look at the implications of recent injuries (not all, just some high-profile ones).
Cold Performers: Players with a low P/G or P/IP in recent weeks.
This article will typically run once per week and will help fantasy managers keep track of players that need to be given extra attention to improve rosters.
The 2025 version of Hot Right Now will typically include three sections:
Current Auctions: A closer look at players being auctioned at a high rate.
Roster Adds: Analysis of players with high add% changes.
Hot Performers: Players with a high P/G or P/IP in recent weeks.
The FanGraphs Ottoneu team plans to run this feature weekly, updating fantasy managers on the biggest movers in Ottoneu leagues with an analysis of how these players could or could not help your roster.
Welcome back to the Ottoneu Starting Pitching Planner. Based on the Roster Resource Probables Grid, I’ve organized every starter slated to start next week into four categories: start, maybe, risky, and sit. The first and last category are pretty self-explanatory. Starters who fall into the “maybe” category are guys you could start if you need to keep up with the innings pitched pace in points leagues or need to hit your games started cap in head-to-head leagues; they’re good bets to turn in a decent start, but you shouldn’t automatically insert them into your lineup. If you’ve fallen behind on the innings pitched pace or you’re really starving for starts in a head-to-head matchup, you could turn to a “risky” starter or two.
I’ve also calculated a “Matchup Score” for each series using a straight combination of opponent’s home/away wOBA, opponent wOBA over the last 14 days, and the park factor for the ballpark the teams are playing in. It’s indexed so that 100 is average and anything above that is a favorable matchup and anything below is unfavorable. That matchup rating informs some of the sit/start recommendations I’m making, though the quality of the pitcher definitely takes precedence. To start the season, I’ll be relying on projected team wOBA until there’s sufficient in-season data to start calculating these matchup ratings. I should also note that the two new minor league stadiums that the Athletics and Rays are playing in this year currently have neutral park factors in my calculations, though both should play like hitters parks (those series are marked in yellow below).
The Dodgers and Cubs gain an extra day off next week to offset their early start in Japan in March. That means they’ll only play five games, though the Dodgers will need to call up a spot starter anyway after Bobby Miller was optioned after his own spot start on Thursday. Roster Resource has Matt Sauer listed as the starter on Wednesday but it’s possible Los Angeles will activate Tony Gonsolin for that start instead.
After spending most of the month rehabbing, we’ll probably see the season debuts of Ranger Suárez, Brayan Bello, Tobias Myers, and Lance McCullers Jr. (!) next week and Jack Leiter and Pablo López are on track to be activated from their short stints on the IL too.
Cold Right Now (CRN) is a weekly Ottoneu feature focused on players being dropped or who should be dropped in Ottoneu leagues. In this feature we will break down players into three sections:
Roster Cuts: Analysis of players who have been cut in a high percentage of leagues.
Recent Injuries: A look at the implications of recent injuries (not all, just some high-profile ones).
Cold Performers: Players with a low P/G or P/IP in recent weeks.
This article will typically run once per week and will help fantasy managers keep track of players that need to be given extra attention to improve rosters.
The wave of early season injuries has hit hard and your fantasy baseball team is more than likely feeling the effects. One of my Ottoneu teams has eight pitchers currently on the IL and I dropped two other injured pitchers in my desperate search for reinforcements. Hopefully, these eight under-rostered pitchers — four starters and four relievers — can help you in your own search for pitching help.
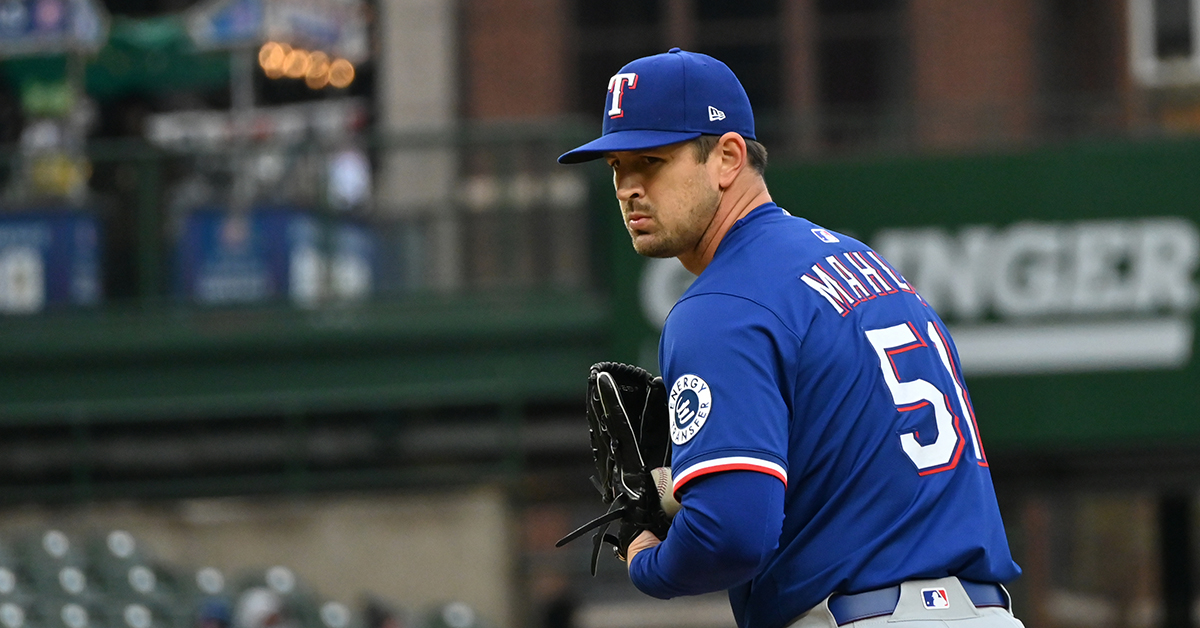
Tyler Mahle is finally healthy after working back from Tommy John surgery in 2023 and a shoulder injury last year. At his peak, he was a strikeout generating machine, producing a 27.1% strikeout rate across three seasons from 2020–22. He hasn’t reached that same level of effectiveness yet, but his first four starts this year have been promising. So far, he’s allowed just two earned runs and eight hits across 19.2 innings, and it seems like the command issues that limited him to just 1.2 innings in his first start are behind him. The velocity on his four-seamer hasn’t returned all the way — and it might not — but he’s getting more induced vertical movement on the pitch than ever before. Opposing batters aren’t swinging and missing against his secondary pitches yet, but the whiff rate on his heater 36.2% of the time! He’s gotten a bit lucky in the batted ball department so I’m sure some regression is coming, but as long as he’s healthy, he looks like he can be a useful starter in all fantasy formats.
Andrew Heaney has been a frequent recommendation in this column over the last few years. He’s the type of pitcher who has hot streaks where he looks incredibly impressive for a time but he isn’t consistent enough to deserve a high roster rate. He’s started off this year on a heater, allowing six runs across 18 innings in his first three starts with a phenomenal 20.0% K-BB%. He’s adjusted his repertoire to feature three different variations of his sweeping breaking ball — Statcast classifies them as a curveball, slider, and slow curve but they’re all generally the same shape with different velocities. He’s also added a sinker to his mix which gives him another weapon to keep batters off his four-seamer. These adjustments to his arsenal have my attention and I’m interested to see if they can help him reduce the amount of hard contact he allows off his heater.
After struggling in the starting rotation for a season and half, Matthew Liberatore found some success pitching out of the bullpen late last year. The Cardinals moved him back to the rotation to start this year and his first three starts of the season have been fantastic from a peripherals standpoint even if the actual run prevention hasn’t been up to snuff. He’s struck out 18 and walked just one in 18.1 innings and he’s managed to work around the platoon issues that have been a problem for him throughout his career. You can chalk that up to a greater emphasis on his changeup and cutter and better command of his entire repertoire.
After signing late in the spring, the Brewers called up Jose Quintana to make his season debut last week and he held the potent Diamondbacks offense scoreless over seven innings. At 36 years old, his best years are probably behind him, but he’s been a useful innings eater for a few years now. One thing to note: he threw his sinker more than half the time in his first start and more than half the balls in play off him were on the ground. Something to keep an eye on if you’re looking to add him.
Many teams are still sorting through the pecking order in their bullpens as they figure out which guys they can trust with high leverage opportunities. The four relievers listed above aren’t necessarily pitching in the ninth or eighth inning, but their peripherals are so good that they could find themselves in those spots sooner rather than later.
Randy Rodríguez has struck out more than 40% of the batters he’s faced so far this season and the Giants are starting to give him more and more high leverage work as a result. Tyler Rogers has been their long-time setup man but Rodríguez’s high-octane stuff fits the role a lot better.
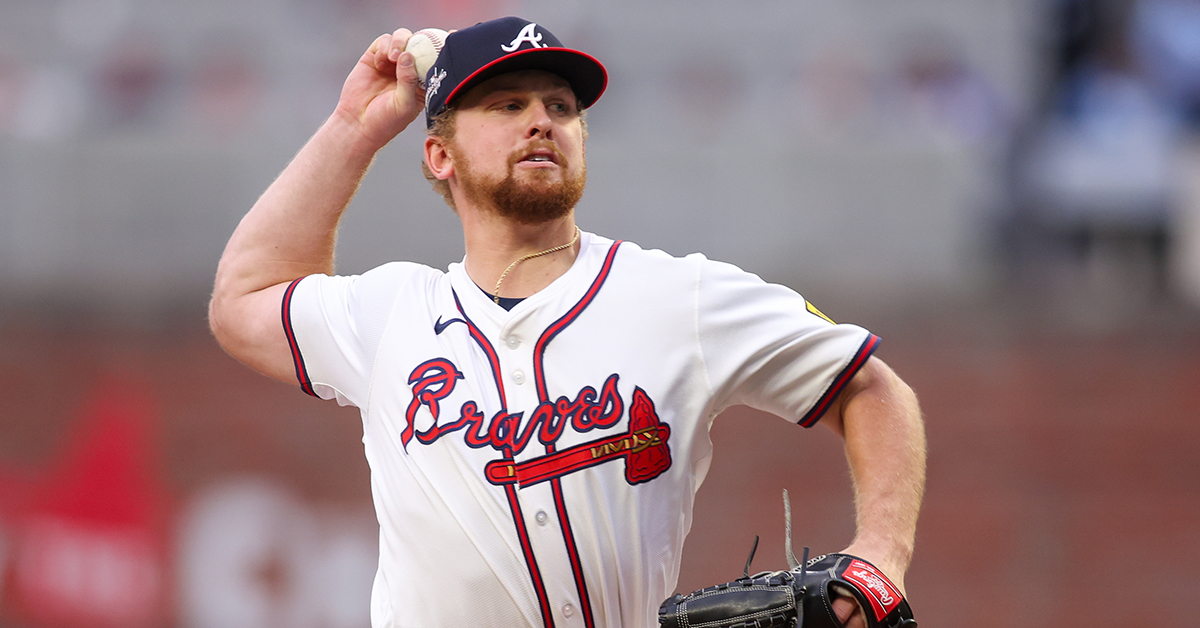
After the Astros traded away Ryan Pressley this offseason, a spot towards the back of their bullpen opened up. Bryan King has quickly filled that opening by also striking out more than 40% of the batters he’s faced. As a left-hander, he’ll likely get high-leverage work when facing pockets of left-handed batters in the late innings, giving him some specific usage patterns.
The Cardinals didn’t really have many good setup options in front of their All-Star closer Ryan Helsley. In steps Phil Maton. He quickly grabbed the eighth inning role in St. Louis and doesn’t really have many competitors for the role.
Injuries wrecked Gabe Speier’s season last year but he’s healthy and firing bullets at the back of the Mariners’ ‘pen. Like King, Speier should see some specific usage patterns as a left-handed reliever and the impending return of Matt Brash could see him pushed down the pecking order in a few weeks.
The 2025 version of Hot Right Now will typically include three sections:
Current Auctions: A closer look at players being auctioned at a high rate.
Roster Adds: Analysis of players with high add% changes.
Hot Performers: Players with a high P/G or P/IP in recent weeks.
The FanGraphs Ottoneu team plans to run this feature weekly, updating fantasy managers on the biggest movers in Ottoneu leagues with an analysis of how these players could or could not help your roster.