Archive for Auction Calculator

Ottoneu: Prospect Pitchers That Might Be Worth Rostering for 2024

ZiPs 2024 gives us some insight as to how prospects will perform if and when they make it to the big leagues. If we can get a general sense of how a player will perform with projections, we can get a general sense of how much they should be valued. To call this process an oversimplification is to look up at the sun and say, “Bright!” Yes, it is an oversimplification, that’s a given. First, we’re trying to predict not only the future performance of a player who hasn’t actually done it yet. Next, we’re trying to determine how much that performance will be worth without any real context. Where will they play? Who will be on their team? Are they as mentally strong as they are physically strong? Finally, we’re assuming they’ll be healthy.

This oversimplified process can only give us a sense of who might perform like a big leaguer in 2024 and since I’m writing from a FanGraphs points scoring system viewpoint, we can make comparisons with other, more established pitchers. Here’s a reminder of my process. First, I find prospect pitchers yet to debut using The Board. Next, I bring in the ZiPs 2024 projections for the players on that list. Not all of them have projections. After that, I convert their projected stats into FanGraphs Ottoneu points. Finally, I throw the prospects and their projected points into Justin Vibber’s Surplus Calculator output for 2023 and make comparisons. The result tells me how these pitchers will perform in 2024 if they are in a pool of 2023 projected players. The dollar value given assumes that next year’s player pool will be much like this year’s player pool. Here’s an example:

Player Comparison and Value Creation
Name IP rPTS rPTS/IP Dollars
Brandon Pfaadt 153.0 738.0 4.82 $5-$8
Jordan Montgomery 157.3 735.7 4.93 $8
*Yellow=Estimated value

Pfaadt is already grabbing the attention of Ottoneu players as his current FanGraphs points average salary is $4, or $3 Median. Will he increase in value by the end of 2024? ZiPs likes his chances and you can compare his projected points total for 2024 with this year’s Jordan Montgomery. If you pay over the average now, let’s say $6, and this projection comes to fruition, you’ll have a good chance of generating value in 2024. There is, however, another scenario where ZiPs is off the mark and he only brings in $4 in 2024. In that case, you’ll be overpaying. Here are the rest of the 2024 ZiPs projected prospect pitchers and what their value could be at the end of the 2024 season:

Projected Prospect Value for 2024
Name IP rPTS PTS/IP Value
Kodai Senga 142.0 688.2 4.8 $13-15
Brandon Pfaadt 153.0 738.0 4.8 $5-8
Tanner Bibee 115.0 466.0 4.1 $3-5
Grayson Rodriguez 121.7 567.4 4.7 $3-$5
Ricky Tiedemann 112.0 513.0 4.6 $3-$5
Robert Gasser 120.0 511.4 4.3 $3-$5
Gavin Stone 108.0 464.0 4.3 $3-$5
Kyle Harrison 112.0 520.7 4.6 $3-$4
Taj Bradley 120.3 528.8 4.4 $2-5
Gavin Williams 110.3 457.1 4.1 $2-$3
Andrew Painter 112.7 451.2 4.0 $2-$3
Daniel Espino 104.3 446.6 4.3 $2-$3
Bobby Miller 105.3 421.1 4.0 $2-$3
Mick Abel 105.0 371.0 3.5 $1-$2
Owen White 104.0 438.1 4.2 $1
Ben Joyce 56.3 275.9 4.9 $1
*Ottoneu FanGraphs Points Leagues
**Estimates generated by comparing players with similar projections to Justin Vibber’s Auction Calculator values

Let’s compare these estimated 2024 values with some current (2023) average/median Ottoneu salaries:

Current FanGraphs Points Leagues Avg./Med.:

Kodai Senga – Average: $15 / Median: $15
Grayson Rodriguez – Average: $4 / Median: $6
Taj Bradley – Average: $3 / Median: $3
Kyle Harrison – Average: $3 / Median: $3
Ricky Tiedemann – Average: $3 / Median: $3
Robert Gasser – Average: $2 / Median: $3
Tanner Bibee – Average: $2 / Median: $1
Gavin Stone – Average: $2 / Median: $2

This is just one way of trying to look into an uncertain future; mashing a bunch of different spreadsheets together and then estimating a value. Is it worth doing, or would you rather just pay a few dollars now to see what happens later? I think this analysis helps us do both. Remember that the goal is to identify future value and not current value. It allows us to prospect on players because we like them or we believe in them or we saw them at a AA game and were impressed. But, it also allows us to put some kind of filter on how we are rostering and for how much. Are you rostering Taj Bradley for $7 because he was bumped up during arbitration, or you got him in a rebuild trade deal when someone else realized his salary was too high? It may be time to re-examine that hold because, by this analysis at least, he won’t reach that value in 2024. Everyone has a strategy and this is just one approach, but it’s utilizing analytical tools and projections from smarter people than myself to provide insight and that can’t be a bad thing.


Ottoneu: These Pitchers Are More Valuable In Points Leagues

Question: What’s the most important thing to remember when drafting in any fantasy baseball league?

Wise-Guy Answer: The type of beer you have on deck.

Wise-Guy’s Friend’s Answer: Making sure you have snacks that don’t grease up your keyboard!

Serious Answer: Your league’s scoring system.

Read the rest of this entry »


Ottoneu: These Players Are More Valuable In Points Leagues

It’s always good to remind yourself of your league’s scoring system before you start a re-draft for the season. If you’re like me and you play in multiple fantasy baseball leagues with multiple scoring systems, things can get a little blended together. Here are some really important points to remember when comparing Ottoneu points and standard roto Read the rest of this entry »


Using ATC’s Inter and Intra Measures to Evaluate Hitters

2023’s PitcherList PitchCon was a great time. If you are unfamiliar with the event I highly recommend going back and watching any of the videos from any one of the four day’s recordings. FanGraphs’ own Ariel Cohen presented a few aspects of his ATC projections that I had never been aware of and think could be very useful in draft preparation. I encourage you to go back and watch Cohen’s talk on The Value of ATC Volatility Charts. In this post, I’ll take a look ATC’s InterSD, InterSK, and IntraSD metrics. Join me by opening a new tab, clicking on over to the ATC projections page, shuffling to the “Fantasy” tab and noticing three columns all the way to the right of the spreadsheet.

Read the rest of this entry »


Treating Hitter Auction Values Like Model Scores

It is always odd to me how fantasy drafters come up with their auction values. “Oh, he’s a $10 SS at least!”. Ok, but, where did you come up with that number? If you load up the FanGraphs auction calculator with your league settings and Steamer projections, you will see exact dollar values that you can use to aid you in auction drafts. I write the word, “aid” because you will very rarely get the player you want for the price the auction calculator spits out. Sometimes you are lucky and get the player for under what the auction calculator thinks he’s worth, and sometimes you push the “Outbid By $1” button a little too much.

Regardless of whether your bid falls below the mark, above it, or right on the mark, the amount you paid cannot be evaluated until the end of the season. But, looking back at last season’s projections versus last season’s actuals can teach us a few things and if we were operating our fantasy team like we were operating a business, we’d all be sitting in the conference room drinking bad coffee and going over the fiscal year. Hopefully, someone brought in donut holes. In this post, I’ll look at 2022 steamer preseason projection values (hitters only) versus 2022 end-of-season values and make comparisons.

Read the rest of this entry »


One Hitter, Two Hitter, Red Hitter, Blue Hitter

Brad Penner-USA TODAY Sports

How would you define Jeff McNeil as a hitter in just a few words? If you had to place him in his own “group” of hitters, who else would you place him with? Last week, I used a cluster analysis to find a player that might compare to Luis Arraez and in turn, help provide some approach recommendations for increasing his power. This week, I’ll use that same cluster analysis, with just a few tweaks, to determine what combination of Statcast and plate discipline metrics increases roto value on average. Let’s start with a refresher on my process.

Read the rest of this entry »


Luis Arraez Needs To Swing and Miss More Often

Jay Biggerstaff-USA TODAY Sports

The 2022 American League batting title was won with .316. It was the lowest batting average to earn the award in the American League since Carl Yastrzemski hit .301 in 1968. Rod Carew earned the best AL batting average in 1972 with .318 and Tony Gwynn hit .313 in 1988 to earn the NL award. But typically, the batting title is awarded for a higher average. The average batting average of players winning the batting title in both the AL and NL over the past 50 seasons has been .345. Arraez’s .316 average was impressive, but it probably won’t benefit your fantasy team when quite enough when it brings only 8 home runs along with it.

Is there room for more power in Arraez’s approach? Don’t tinker with a good thing is what I immediately think, but then again, will .316 and probably slightly below (Arraez steamer 2022: avg .305), continue to top leaderboards? Furthermore, Arraez is up for arbitration prior to the 2023 season and won’t be a free agent until 2026. He has plenty of room to work for a few extra dollars in the power department. Shoot, he even said he wanted to add power himself when speaking with two of the most powerful in Giancarlo Stanton and Aaron Judge at the All-Star game (0:36):

So, what can he do? How can Luis Arraez add a little more power without changing who he is? I’m not a swing expert, but I did stay at a Holiday Inn last night and I know how to run a clustering model on high-dimensional data. But we’ll get to that in a minute.

Let’s start with who he is. First, he’s a man who does not strike out. He had the lowest K% at 7.1% among qualified hitters in 2022. He also never swings and misses. His 2.5% SwStr% was also the lowest among qualified hitters and lower than the new kid on the block Steven Kwan’s second place 3.1%. Second, he doesn’t steal bases. Four bags in 2022 and two bags in 2021 didn’t accentuate Arraez’s ability to get on base. Lastly, he doesn’t hit for power. His .104 ISO ranked 12th from the bottom among qualified hitters in 2022. From a fantasy perspective, Arraez is not necessarily a one-sided player, but he’s close. He got on base enough times to be driven in to score enough times and both his mR and mAVG returned positive value according to our auction calculator:

Luis Arraez, 2022 YTD Value
Name PA mAVG mRBI mR mSB mHR PTS aPOS Dollars
Luis Arraez 603 $6.93 -$2.79 $3.07 -$1.53 -$3.61 $2.07 $9.51 $12.59

So where does this profile place him amongst his peers? Well, looking at a lot of columns in a spreadsheet can make it difficult to put a single label on a player. There’s just too much to sway your opinion. In order to combat this and help us create a more summarized view of many metrics, I’ll use a Principal Component Analysis (PCA) to “increas[e] the interpretability of data while preserving the maximum amount of information, and enabling the visualization of multidimensional data”. I created two sets of variables, one mostly batted ball, and plate discipline and the other Statcast metrics with a few non-Statcast metrics that more or less define power. Here they are:

Batted ball and plate discipline metrics
LD%, GB%, FB%, Pull%, Cent%, Oppo%, Swing%, Contact%, Zone%, SwStr%, CStr%

Statcast/power metrics
HR/FB,EV, maxEV, LA, Barrels, Barrel%, HardHit, SLG, xSLG

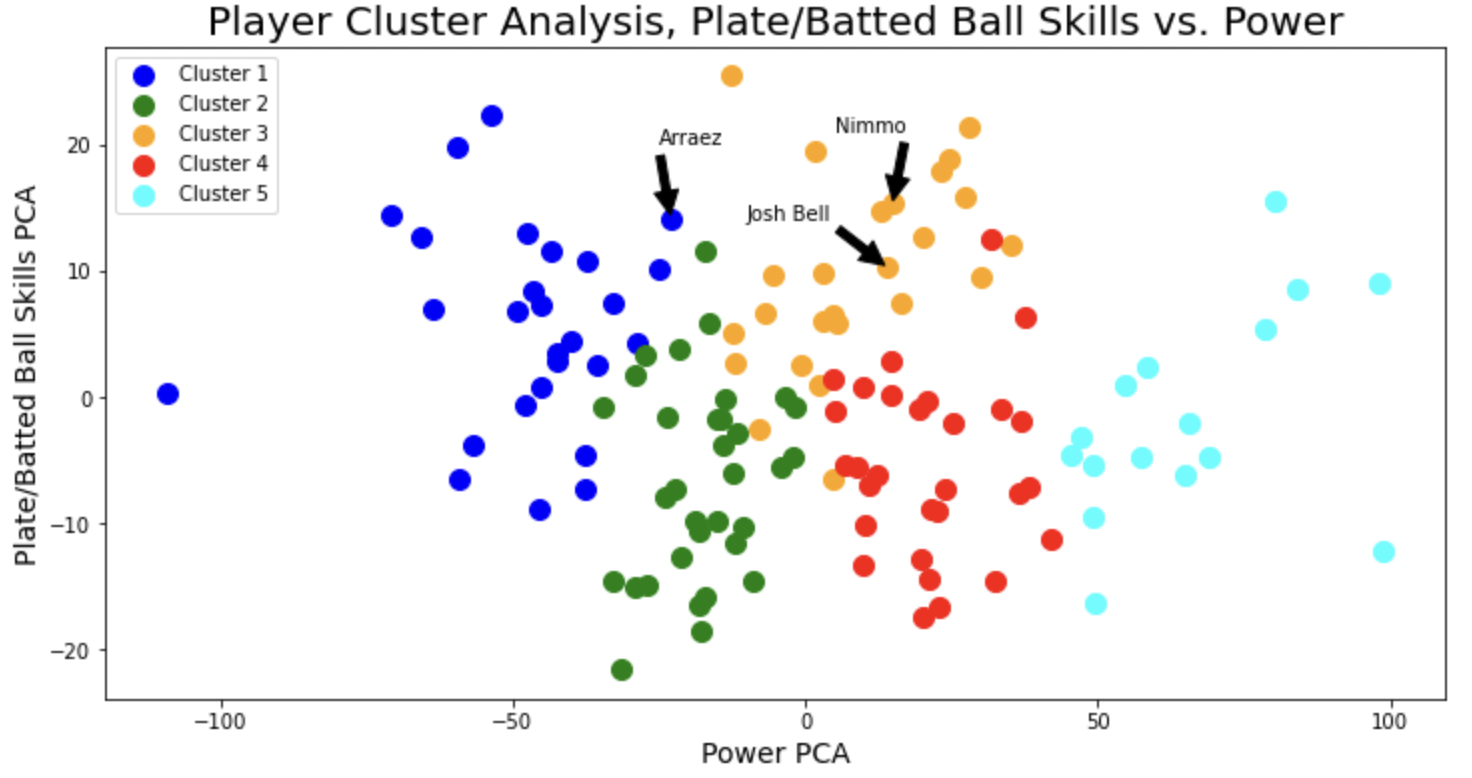
With a PCA I’m able to reduce these lists to two numbers which can then be passed through a k-means cluster analysis, grouping players into nice segments for visualization. Typically, a cluster analysis is used to gather insights on unlabeled data and it is a type of unsupervised learning. In this case, we’re using it to make comparisons we otherwise wouldn’t have:

Cluster Diagram 1

Arraez finds himself, surprisingly, in the high-power end of cluster 1. To better understand why that is, we can compare his Statcast/power metrics with the averages from cluster 1. In addition, I’ll throw in that player all the way to the left, Tony Kemp, to help us compare Arraez with his cluster-mates:

Cluster 1 Metrics
Name HR/FB EV maxEV LA Barrels Barrel% HardHit SLG xSLG
Tony Kemp 4.3 84.4 103.2 15.0 7 1.6 65 0.334 0.291
Luis Arraez 4.8 88.9 107.3 12.9 18 3.6 153 0.420 0.408
Cluster 1 Average 7.7 86.7 108.8 12.2 17 4.2 126 0.383 0.365
SOURCE: Statcast

Now we have a group for Arraez that makes sense. Next, let’s look at a few players who are higher up on the power scale, but aren’t changing too much in the batted ball/plate discipline area. Here’s our cluster image from before but with two new names identified that might be able to help Arraez inch over to the next cluster:

Cluster Diagram 2

Shifting into Cluster 3
Name HR/FB EV maxEV LA Barrels Barrel% HardHit SLG xSLG
Josh Bell 12.1 88.9 112.2 8.3 33 7.2 186 0.422 0.424
Brandon Nimmo 10.9 89.4 111.9 6.1 33 7.0 187 0.433 0.409
Arraez 4.8 88.9 107.3 12.9 18 3.6 153 0.420 0.408
SOURCE: Statcast

I am not saying that Luis Arraez should just go up there and try to be more like Josh. But I am using him as an example to determine what makes his profile more powerful. Josh Bell, 6′ 4″ / 255, and Luis Arraez, 5′ 10″ / 175, are different. While I don’t expect Luis Arraez to just suddenly increase his exit velocity, I am certain he has the skills to change his approach. One place to start would be adding more pull.

Shifting into Cluster 3
Name LD% GB% FB% Pull% Cent% Oppo% Swing% Contact% SwStr%
Josh Bell 18.6 50.4 30.9 38.4 36.0 25.7 45.3 80.6 8.8
Brandon Nimmo 17.7 50.5 31.7 32.1 38.5 29.4 43.7 82.6 7.6
Luis Arraez 25.8 41.2 32.9 31.6 37.9 30.6 42.7 94.1 2.5
SOURCE: Statcast

Josh pulls the ball more. Josh also swings and misses more often. But while not swinging and missing is really impressive in this day and age, how valuable is it from both a fantasy perspective and a real-life perspective? Increasing his swinging-strike percentage while also increasing his slugging percentage would benefit everyone involved. Arraez is already hitting the ball with decent slugging results when it’s put inside, though he could improve on high-inside pitches, and all of his 2022 home runs came off pulled balls:

Arraez SLG/BIP Heatmap

Luis Arraez 2022 Home Run Spray

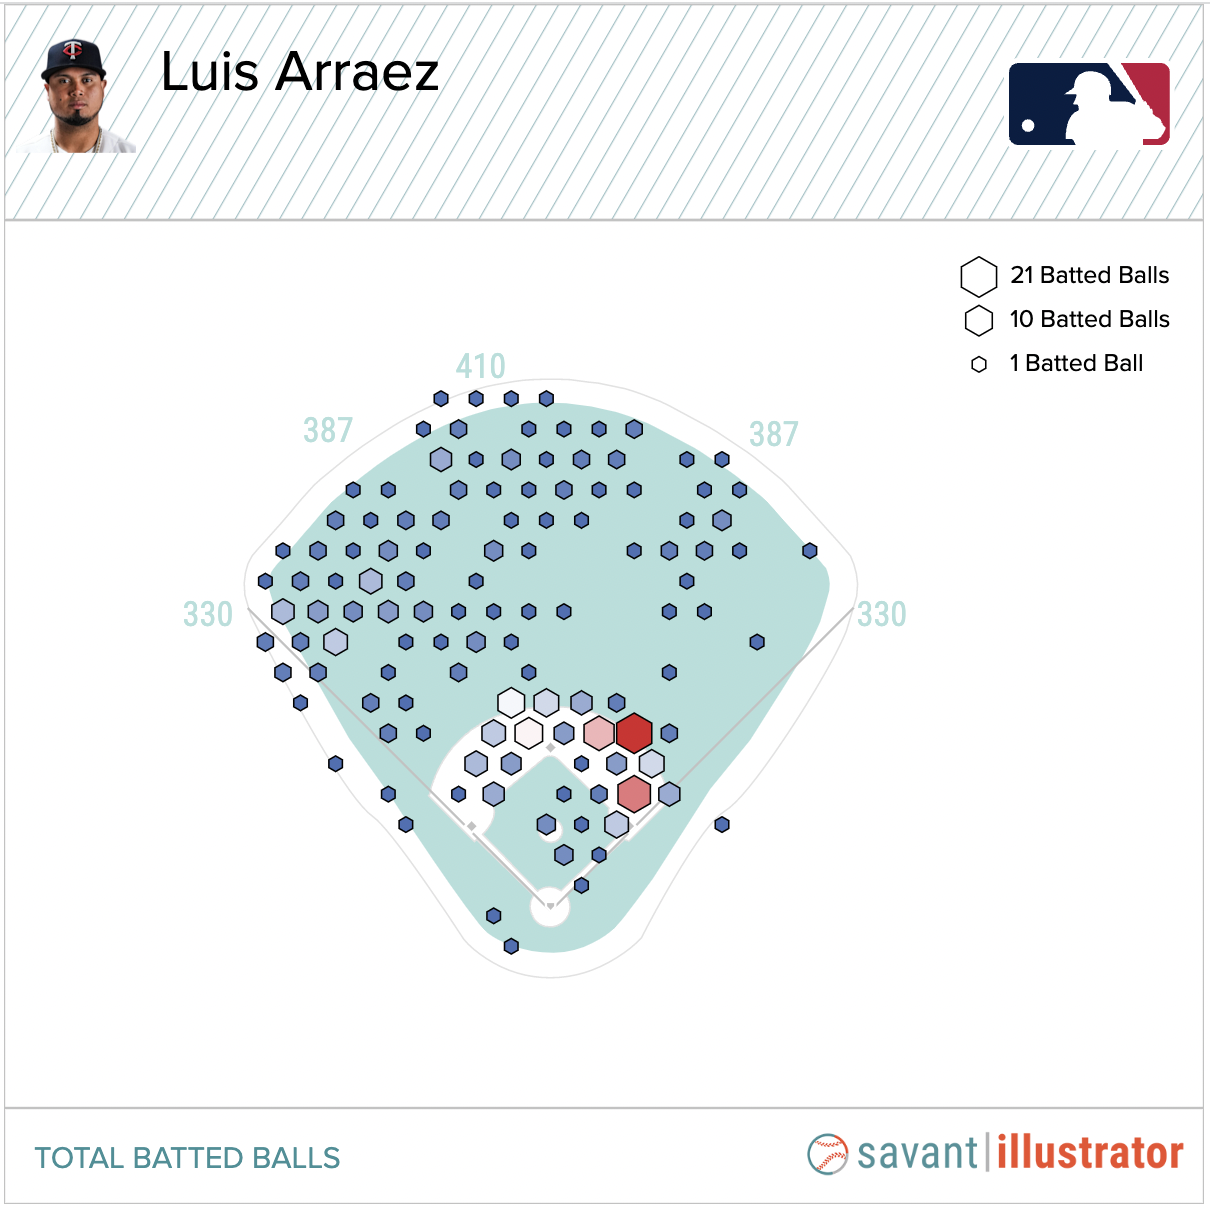
While watching a player who can spray the ball all over the field is fun, Arraez’s numbers aren’t great when going oppo. He slugged .638 when pulling the ball but when he slapped the ball the other way in 2022, he had mediocre results and his slugging percentage was brought down to .364. Just look at how many outs he hit into the opposite direction:

Arraez Field Out Spray

In 2022, Arraez’s HardHit% increased from 27.8% to 30.6% when he pulled the ball. When he was ahead in the count and pulled the ball, it jumped to 32.5%. Given a little more freedom from the worry of striking out, he added more power. But, here’s where things get a little odd. Arraez put the ball in the air more often than Bell and Nimmo in 2022 and his average launch angle was higher as well. If we look at his baseball savant radial chart isolated to singles, doubles and home runs (he only hit one triple in 2022), he clearly knows how to elevate the ball to hit for power:

Luis Arraez Radial

But, without the exit velocity to take the ball out, he ends up with a lot of fly ball outs. Looking at the table above, he’s putting the ball in the air more often than Nimmo and Bell but with a significantly lower HR/FB rate.

Arraez Field Outs

Let’s summarize. Luis Arraez could be more valuable if he hit with a little more power. One way he might add power is to start pulling the ball more and leveling out his swing ever-so-slightly. This may cause him to swing and miss more often, but he can afford it. Arraez earned nearly $13 in 2022 and we should expect that to increase if he can adjust. It may seem nuts, but Luis Arraez needs to start swinging and missing more often.


The Possibilities and Limitations of wRC+ for Fantasy Managers

Here are two players who accumulated over 450 PAs in 2022 and a few stats to accompany them, choose one for your fantasy team:

Player A, DH
128 wRC+
18 HR
0 SB
FanGraphs Auction Calculator YTD 2022 Value (Default settings): $1.5

Player B, DH
119 wRC+
16 HR
0 SB
FanGraphs Auction Calculator YTD 2022 Value (Default settings): $9.6

Surely, you wouldn’t just choose player A without wanting to know more but if you had to choose, you absolutely had to, you would choose player A, right? You would do this because Player A’s wRC+ is higher and he hit more home runs. But now look at the rest of the roto stats each player accumulated in 2022:

Player A, DH
128 wRC+
18 HR
0 SB
.238 AVG
47 R
59 RBI
FanGraphs Auction Calculator YTD 2022 Value (Default settings): $1.5

Player B, DH
119 wRC+
16 HR
0 SB
.274 AVG
76 R
62 RBI
FanGraphs Auction Calculator YTD 2022 Value (Default settings): $9.6

With this new information, you would have to choose Player B. You would surrender two home runs for 29 more runs and three more RBI. But, is it fair to say those runs and RBI minus two home runs are worth $8? And why is Player A’s wRC+ 9 points better? Let’s start digging and then we’ll see if we can find our way back out.

wRC+ is by our definition, “the most comprehensive rate statistic used to measure hitting performance”, but it places heavy emphasis on runs. Here are the correlations between wRC+ and fantasy stats from the 2022 season (over 200 PAs):

wRC+ Correlations, 2022
wRC+
wOBA 0.99
OBP 0.87
Dollars 0.75
AVG 0.72
HR 0.69
RBI 0.67
R 0.66
PA 0.50
SB 0.13
Among hitters with over 200 PAs

Player A wOBA: .349
Player B wOBA: .343

Intuitively that makes sense. The statistic is called weighted runs created plus. But, it can be confusing if we consider our two examples above. Player A literally scored less runs himself and drove in less runs than Player B, yet he has a larger wRC+.

Let’s do some nitty-gritty mathematics and calculate each players wRC+ manually to see if we can surmise what’s going on:

wRC+ = (((wRAA/PA + League R/PA) + (League R/PA – Park Factor* League R/PA))/ (AL or NL wRC/PA excluding pitchers))*100

Player A wRC+ = (((14.4/461 + .114) + (.114 – .975 * .114))/ (10,600/91,118))*100 = ~128
*Played in the NL

Player B wRC+ = (((15.7/596+ .114) + (.114 – 1.06 * .114))/ (10,227/90,850))*100 = ~119
*Played in the AL

Even if we changed this calculation and placed player A in Player B’s league, creating the same denominator for both players, Player A would actually increase in wRC+. No, the issue is not league-specific or even park-specific, it is in the plate appearances. Player A was simply more productive in wRAA because he didn’t get enough plate appearances to maybe go through a few additional slumps. So, Player A has a better wRC+ because he was more productive with the plate appearances he was given, even though Player B was able to accumulate more statistics. That’s really the essence of what’s going on here. Player B accumulated more raw stats for your fantasy team than did Player A.

But, does it mean that if a player finished the season with an above average (over 100) wRC+ they have returned positive value? Well, it depends on how much you’ve paid as the fantasy manager, but in general, no.

wRC+ vs. Dollar Value, Scatter Plot

There can be plenty of situations, most plate appearance based, where a player may post above average wRC+, but does not bring positive value or is no better than a replacement-level player. Take, for example, Lars Nootbaar who posted a 125 wRC+ in 347 plate appearances with an 8.9 wRAA. That’s above average. But over the course of an entire season, there were plenty of other outfielders who would have been better for your fantasy team. If you had an injury and were able to replace that injured player with Nootbaar for those 347 plate appearances, swell! But, when compared to the player pool given by the auction calculator, Nootbaar’s 2022 season cost fantasy managers $0.50. On the flip-side of this argument is Jose Trevino. Though significantly hurt by his poor production (-4.7 wRAA/91 wRC+) he still generated $4 in value because of the large positional adjustment he receives for being a catcher. This just goes to show how important using the right statistic is when it applies to your fantasy team. Had you looked at Trevino’s wRC+ and thought, “Oh, he’s below average”, you would have missed out on a $4 catcher.

The main rule of thumb for when you find yourself down in a hole and looking to get out is to stop digging. Have we found something in the shovels full of dirt? Fantasy managers should not blindly use wRC+ as a metric for selecting fantasy value. Plate appearance accumulation is still king. But, if you’re the type to zig while everyone else zags, you may be able to use wRC+ to find fringe-level players who others have looked over. If you look at the 0 line in the scatter plot above, just above it are players who were worth $1. In addition, there are a number of players who returned negative value but were very productive at the season’s end. While wRC+ has become more and more common as a one stop shop type of offensive production metric, perhaps it is falsely molding your competitor’s impression of a player and therefore can be used to your advantage.

Player A: Daniel Vogelbach (park factor was the average of Pirates and Mets)
Player B: J.D. Martinez


Steamer “Overvalued” vs ADP: Top 50 Starting Pitchers

With drafts going and projections being released it is time to look at what they say about each other. This week I am going to look at what Steamer says about who is undervalued and overvalued at their current ADP. I took the FanGraphs Auction Calculator Values for Steamer and compared them to the current NFBC ADP to see which names jumped out at me within the top 50 starting pitchers according to Steamer’s projections. Read the rest of this entry »


Steamer “Values” vs ADP: Top 50 Starting Pitchers

With drafts going and projections being released it is time to look at what they say about each other. This week I am going to look at what Steamer says about who is undervalued and overvalued at their current ADP. I took the Fangraphs Auction Calculator Values for Steamer and compared them to the current NFBC ADP to see which names jumped out at me within the top 50 starting pitchers according to Steamer’s projections. Read the rest of this entry »