Breaking Down BABIP: What Impacts Ground Ball Batting Average for Pitchers?
In the second installment in my series on the factors impacting components of BABIP, I move on from flyball BABIP for pitchers to ground ball batting average for pitchers. This analysis produced one result that really surprised me: whether or not a pitcher has a tendency to allowed pulled grounders does not have much of an impact on the ground ball batting average they allow. I didn’t anticipate this, because hitters put up a collective .180 batting average on pulled grounders in 2019, but a .306 average on all other grounders. For pitchers who allowed at least 225 grounders in seasons between 2015 and 2019 (n=286), the negative relationship between pull rate and ground ball batting average allowed (GB Avg) was significant at p < .05, but with just an .012 Pearson’s r.
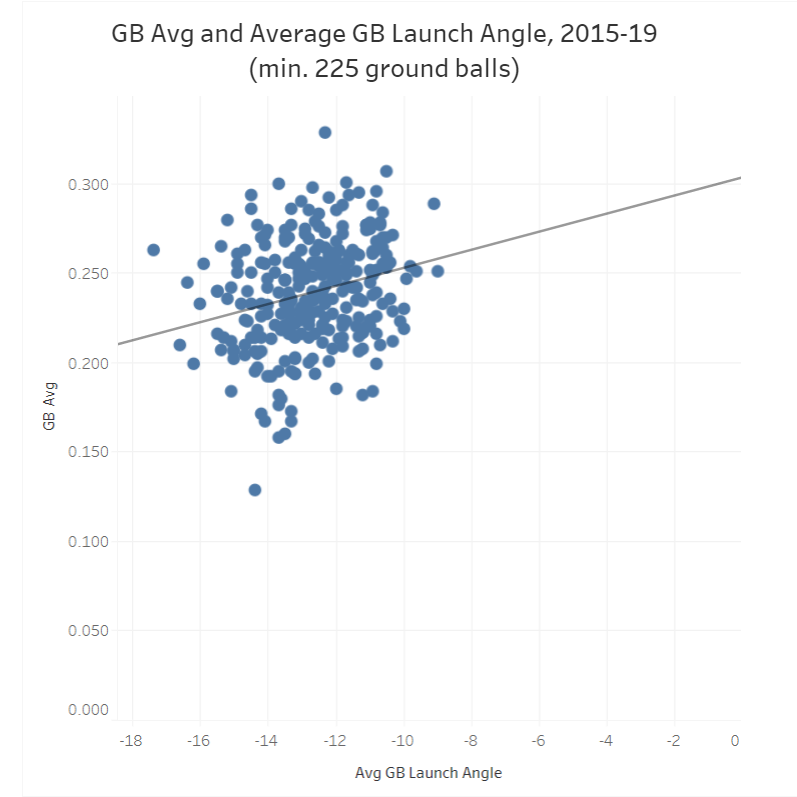
Average ground ball exit velocity was more strongly correlated with GB Avg (p < .002, r = 0.19), but not as strongly as average ground ball launch angle was (p < .0001, r = 0.25). The finding that there is a positive relationship (as depicted in the graph below) makes sense. We would expect that pitchers would have better results on balls that xStats used to classify as “dribblers” as opposed to grounders that have a higher launch angle. These results suggest that average ground ball launch angle (GB LA) is a reliable indicator of whether a pitcher’s GB Avg is aberrant and due to regress. That notion is reinforced by the another finding — that GB LA is highly sticky. Within this sample, the correlation of a pitcher’s GB LA from one season to their next season with at least 225 grounders was significant at p < .0001 with an Pearson’s r of 0.40.
Better yet, I found that when a pitcher allows a ground ball batting average that is out of whack with what GB LA would predict, it typically regresses in the next season in which the pitcher allows 225-plus grounders. The relationship between year-to-year change in GB Avg and the difference between GB Avg and expected GB Avg in the first of those seasons had a Pearson’s r of 0.61.
If we look at the 47 pitchers who induced at least 225 ground balls in 2019, we find that 10 of them had a GB Avg that was at least 30 points below their expected mark, and another three were at least 30 points above their expected GB Avg. Two names stand out as particularly interesting, because they also showed up on my list of over- and under-performers for flyball BABIP. It appears that Eduardo Rodriguez got a raw deal on both ground balls and flyballs last season. While we might be inclined to chalk that up to him pitching home games at Fenway Park, which is a notorious high-BABIP venue, we should note two things about Rodriguez’s .317 overall BABIP. It was a career high, and it was skewed by a .351 BABIP in his road starts. While several projection systems have Rodriguez due for an ERA above 4.00, he looks like a good bet to be close to or better than last year’s 3.81 mark.
| Pitcher | GB Avg | xGB Avg | Difference |
|---|---|---|---|
| Dakota Hudson | 0.171 | 0.232 | -0.061 |
| Hyun-Jin Ryu | 0.180 | 0.235 | -0.055 |
| Zack Greinke | 0.194 | 0.240 | -0.046 |
| Aaron Nola | 0.210 | 0.250 | -0.040 |
| Brett Anderson | 0.195 | 0.231 | -0.036 |
| Merrill Kelly | 0.209 | 0.244 | -0.035 |
| Stephen Strasburg | 0.197 | 0.232 | -0.035 |
| Adam Wainwright | 0.219 | 0.253 | -0.034 |
| José Berríos | 0.216 | 0.249 | -0.033 |
| Joe Musgrove | 0.214 | 0.244 | -0.030 |
| Max Fried | 0.261 | 0.229 | 0.033 |
| Eduardo Rodriguez | 0.271 | 0.233 | 0.039 |
| Mike Minor | 0.307 | 0.251 | 0.057 |
The other pitcher who was flagged for having an aberrant flyball BABIP last season is Adam Wainwright. While he apparently deserved a flyball BABIP that was 95 points lower than what he got, his GB Avg should have been 34 points higher. Wainwright’s .319 overall BABIP may still have been slightly inflated, but he may not have been significantly cheated after all. That also makes sense in light of his three previous BABIPs all being in the .310-to-.330 range.
No pitcher had a GB Avg that looked more aberrant — either on the positive or negative side — than Dakota Hudson. For those who question last season’s .274 BABIP, 3.35 ERA or even his 1.41 WHIP, you have your validation. He may need to have even more skeptics, as his 233 ADP on FantasyPros shows that he is still receiving plenty of trust from owners in 12-team mixed leagues.
Three pitchers from the top 20 in ADP among starters have also made it onto the list of potential overperformers. Stephen Strasburg appears to be due for some regression from a .274 overall BABIP, though he can still provide an appropriate return on his top-30 overall ADP with a normal BABIP. The same is true for Aaron Nola, but Zack Greinke may have a difficult time performing like a top-20 pitcher if he has a normal BABIP in 2020. He has posted low BABIPs fairly consistently in recent years, but last year’s .271 mark might have been a fluke, as his LA GB increased to its highest level in the Statcast era (-12.6 degrees). That, in combination with potential regression from an 0.91 HR/9, could knock him out of the top 20.
Mike Minor appears to have had the worst luck on ground balls last season, and his 2019 GB Avg is one of the biggest outliers during the Statcast era. He had a .213 GB Avg and a .259 overall BABIP in 2018 with a nearly identical GB LA and average ground ball exit velocity to what he had in 2019, so we can expect him to have a below-normal BABIP in 2020. He probably won’t strand 80.3 percent of his baserunners again, but with fewer baserunners, Minor could have another season with a sub-4.00 ERA.
It also appears that Max Fried gave up more ground ball hits than he deserved to in 2019, but we should also bear in mind that he also allowed a lot of hard ground ball contact. In averaging 86.2 mph in exit velocity on ground balls, Fried’s regression from an overall .336 BABIP could be mild. He had been a high-BABIP pitcher over the previous two seasons, both in the majors and minors, so projection systems that have Fried with a BABIP around .320 probably have it right.
Al Melchior has been writing about Fantasy baseball and sim games since 2000, and his work has appeared at CBSSports.com, BaseballHQ, Ron Shandler's Baseball Forecaster and FanRagSports. He has also participated in Tout Wars' mixed auction league since 2013. You can follow Al on Twitter @almelchiorbb and find more of his work at almelchior.com.
Great stuff Al. How are you filtering this? I’d love to see pitcher BABIPs on hard hit grounders, but even after playing with the Splits I struggled to figure it out.
Thanks! I’m using Statcast’s ground ball/flyball classifications. Is that what you were asking?