Breaking Down BABIP: What Impacts Flyball BABIP for Pitchers?
A little more than a year ago, Alex Chamberlain and I looked into what type of impact a slew of Statcast measures had on a pitcher’s overall BABIP rate. Hard-hit rate and exit velocity on ground balls (EV GB) had the strongest correlations, but it seemed unlikely that the latter would have much to say about which pitchers would be best at limiting hits on flyballs in play. In general, it seems that BABIP could be influenced by different factors depending on the type of batted ball.
So let’s test that out. This column is the first in a series of four where I will be looking at the impact of various measures on flyball BABIP and ground ball Avg, both for pitchers and hitters. I’m kicking this off with an analysis of flyball BABIP for pitchers.
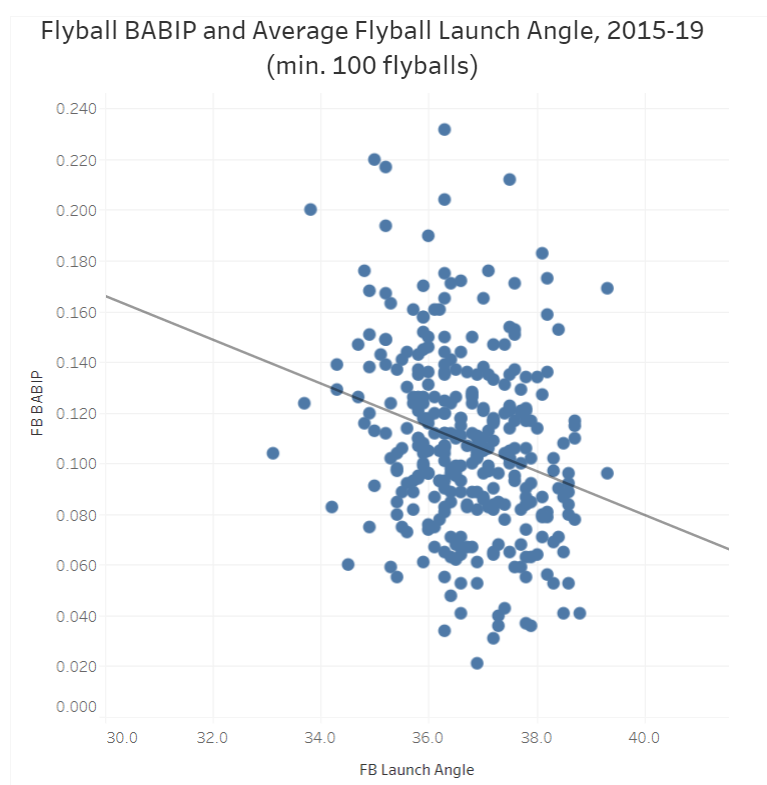
The findings were pretty straightforward. It turns out that a few factors that are strongly associated with flyball ISO — namely, exit velocity, distance and pull rate — have nothing close to a statistically significant relationship with flyball BABIP. Only one factor that I included in my study did: flyball launch angle. With a Pearson’s r of 0.26, it’s not exactly an airtight relationship, but it is highly significant (p < .0001) nonetheless.
The graph below displays that relationship for all pitchers who allowed at least 100 flyballs in a season between 2015 and 2019 (n=316). As one would expect, the relationship is negative, meaning that pitchers who tended to allow higher flyballs typically had lower flyball BABIPs. While there is a sizable cluster of cases hovering around the regression, there are also several strong outliers. Four of the five largest positive outliers (i.e. BABIP underperformers) are from last season. For those four — Eduardo Rodriguez, Steven Matz, Adam Wainwright and Zack Wheeler — the findings of this analysis could have implications for their 2020 performance.
Before we can determine what the implications of their outlier status are, we need to answer two questions. First, is flyball launch angle for pitchers sticky? In this study, the year-to-year correlation between a pitcher’s flyball launch angle in one season and their flyball launch angle in the following season (in which they allowed at least 100 flies) was significant at the p < .01 level. So there is a high degree of year-to-year stickiness.
Second, when a pitcher’s flyball BABIP departs from the rate that we would expect, given what their average flyball launch angle is, does their flyball BABIP typically regress to an expected level the next season? The answer here is also “yes.” I calculated the difference between a pitcher’s flyball BABIP in one season and their flyball BABIP in the next season in which they allowed 100-plus flies and regressed that against the difference between their actual flyball BABIP and their expected flyball BABIP in the first of those seasons. (By expected flyball BABIP, I mean what it would have been if it was determined by the regression equation, 0.4251-(average flyball launch angle * 0.0086).) The Pearson’s r for that negative relationship was a robust 0.63. In other words, if a pitcher over- or under-performed in terms of flyball BABIP, they had a strong tendency for regression the following season they pitched with at least 100 flyballs. The greater the over- or under-performance, the greater the regression.
To recap, we can have confidence in a pitcher approaching their average flyball launch angle from a previous season, and if that launch angle produced an aberrant result in terms of flyball BABIP, we can expect that BABIP to regress. In 2019, there were six pitchers whose expected flyball BABIP was at least 60 points higher or lower than their actual flyball BABIP. In addition to the four pitchers mentioned above, Madison Bumgarner and J.A. Happ were also highly aberrant in terms of flyball BABIP, and Happ was the only one of the six to overperform.
| Pitcher | BABIP | xBABIP | Difference |
|---|---|---|---|
| Eduardo Rodriguez | 0.212 | 0.103 | 0.109 |
| Steven Matz | 0.220 | 0.124 | 0.096 |
| Adam Wainwright | 0.217 | 0.122 | 0.095 |
| Zack Wheeler | 0.204 | 0.113 | 0.091 |
| Madison Bumgarner | 0.169 | 0.087 | 0.082 |
| J.A. Happ | 0.043 | 0.103 | -0.061 |
That’s bad news for Happ, who posted a lower-than-average .280 overall BABIP despite recording his highest line drive rate in three seasons (21.5 percent). This is but one factor to consider when setting expectations for the Yankees’ lefty this season. Still, even if you are optimistic about the offseason mechanical adjustments Happ has made, his improvement could be muted by some BABIP regression.
Of the five pitchers who had apparent bad luck on flyballs, three (Rodriguez, Wainwright and Wheeler) had overall BABIPs in the .310-to-.320 range, and thus are candidates to get back within a normal range. Bumgarner (.289) and Matz (.301) were both close to normal, but Bumgarner has frequently had rates below .280, while Matz compiled a .267 BABIP in 2018. It’s probably not coincidence that Bumgarner has the highest average flyball launch angle allowed of any pitcher who has induced at least 200 flyballs over the last three seasons. All five should be due for some BABIP regression in 2020, which could slim down their WHIPs and ERAs.
At the opposite end of the continuum from Bumgarner are pitchers like Carlos Carrasco, Kyle Gibson and Chris Archer who have been prone to allowing lower flies that have contributed to higher BABIPs in recent seasons. While Carrasco will almost certainly improve from a .354 BABIP, Archer may actually give up more hits on balls in play after recording a .298 BABIP in 2019.
Al Melchior has been writing about Fantasy baseball and sim games since 2000, and his work has appeared at CBSSports.com, BaseballHQ, Ron Shandler's Baseball Forecaster and FanRagSports. He has also participated in Tout Wars' mixed auction league since 2013. You can follow Al on Twitter @almelchiorbb and find more of his work at almelchior.com.
Interesting. I worry (as an E-Rod owner in a keeper league) that he won’t get the regression because the Green Monster might have something to do with his problems. A pop-up double happens there often enough. Mad-Bum might also have some problems—even though Arizona isn’t bad for pitchers anymore, nothing’s better than San Francisco’s park.
Good point about E-Rod. though I think, at worst, he’ll regress to a normal BABIP, like he’s had in other seasons. I do expect MadBum to increase his HR/9, though maybe not as much as the projections systems have it. I do think his BABIP and WHIP will fall.