Right-hander Griffin Canning, meanwhile, was described by manager Phil Nevin as “full go,” notes Jeff Fletcher of the Orange County Register. The Angels plan to be cautious with the former second-rounder and top prospect after he missed the 2022 season due to a back injury, but Nevin says he’ll throw live batting practice this week.
Manager Phil Nevin said he has seen a committed, centered Rendon this spring, with visions of a batting order starting with Taylor Ward, Mike Trout, Shohei Ohtani and Rendon.
On the infield, there will be no more shifts. Teams must have at least two fielders stationed on each side of second base, standing on the dirt. But one overlooked rule: Infielders can actually switch positions between innings (though not during innings). So say an opposing team had two lefties due up. The Tigers could conceivably move Javier Báez to second base, move Jonathan Schoop from second to third and move Nick Maton from third to short. That would allow the rangy Báez to patrol the infield against lefty hitters.
“One thousand percent, I think one team will do that,” Hinch said. “I can think of one team in particular.”
Hinch was referring to the savvy Tampa Bay Rays, whom the Tigers will face in their opening series.
“I’m not sure we’ll do it,” Hinch said, “but that will be the next curiosity.”
Max Stassi said he spent the offseason “simplifying things” after he struggled offensively in 2022. Specifically, he said he wanted his swing to stay on a consistent plane. He generally felt that his underlying batted balls numbers were good but that he needs to make more contact. Regarding the competition to win the starting job, Stassi said: “I just go out there and try to handle my business. … Whatever they think is the best team out there to win games, that’s what I care about.”
“I’m in a good spot and I’m very, very happy about it,” Springer said. “It feels good to feel good.”
Following the end of last season, Springer said he stayed in Toronto longer than he normally would have to allow for his concussion symptoms to subside before returning home. Only a short time after, in late October, Springer travelled to see Dr. Keith Meister in Dallas and underwent surgery to remove the bone spur in his elbow that he’d been playing through since at least June.
…
The bone spur was large enough that Springer explained he could feel it underneath his skin and, at its worst, he couldn’t hold his arm out straight.
Rendon is fully healthy after dealing with a right wrist injury last year and is looking to finally put together a full, productive season with the Angels.
It’s time for another examination of projection accuracies while I finish up hitters. I will focus on rate stats along with a different look at the RBI and Runs totals. The results are just slightly different than last year and now the aggregators take the top
It’s time to continue examining projection accuracy. Today, it’s a quick run through the hitter counting stats. From last year’s results, I came to the following conclusion.
Hitter Rate/Counting Stats
For the stand-alone projections, THE BATs stands out (I’d use THE BAT X). Just below THE BAT are all four aggregators.
The most important question in the pen will be whether Andrés Muñoz and Paul Sewald ready to go after offseason surgeries. Dipoto gave encouraging reports on both – Muñoz is out of a walking boot and started a throwing program two weeks ago, while Sewald has had multiple throwing sessions. He anticipates both “being ready to throw in games in Arizona.”
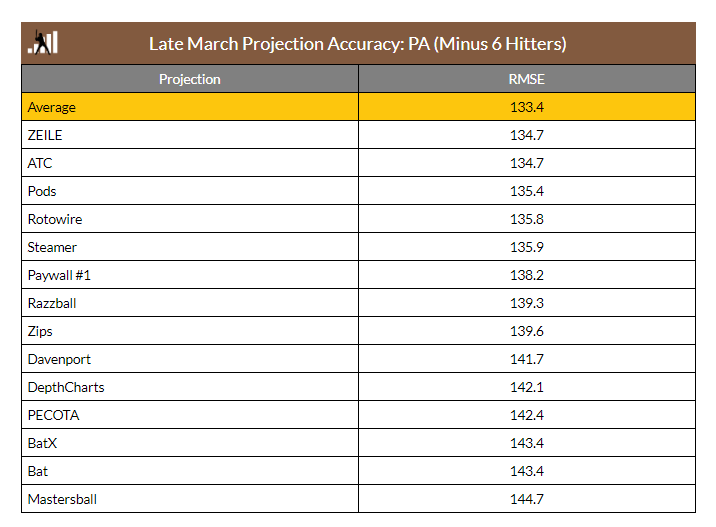
What started as a checkup on how projections turned into a fairly important find when using projections. On the projection front, aggregators, especially when done smartly, continue to crush the competition. The big illumination is ZiPS being near the top since it uses zero human input.
First off, here are last season’s results with my conclusion.
Hitter Playing Time
For playing time, three of the aggregators, Average, ZEILE, and ATC shoved in this category (Depth Charts takes a hit because it only uses one playing time input). It’s an easy win for the Wisdom of the Crowds.
To find this year’s player set to test, I used all the hitters drafted in at least 42 of the 47 NFBC Main Events. From this list, I excluded Seiya Suzuki because several systems didn’t include him. Also, I excluded Nelson Cruz, Luis Garcia, Manuel Margot, Jake Fraley, Seth Brown, Garrett Cooper, and Darin Ruf 러프. One or multiple systems didn’t have a projection for them. In all, I would have removed four projections, but decided it was better to have more projections and a few players missing. In all, this process was run on 223 hitters.
To determine accuracy, I calculated the Root Mean Square Error (RMSE) for four different sets of values. RMSE is a “measure of how far from the regression line data points are” and the smaller the value, the better.
I collected the projections on April 6th from a mix of 23 different sets. Some were free while others were behind a paywall. Those behind a paywall will be labeled as Paywall with a number (e.g. Paywall #1). Additionally, some of the projections were aggregates of other projections. All but one of the aggregators were publicly available. The one that wasn’t is called Aggregator #1. ATC, Depth Charts, and ZEILE are the projections that aggregate their competitors. Also, Steamer, ZiPS DC, and Depthcharts use the same playing time projections. THE BAT and THE BAT X use the playing time from ATC.
Finally, I looked into several ways to aggregate the projections to see if there was a preferred method and they were:
Average of all
Median of all
Preseason smart average: For this one, I had Rob Silver look at last season’s results, pick three sources to average, and they were used. He chose THE BAT X, Razzball, and Paywall #6.
Post-season best average: This started with an average of nine of the projections that I know get regular updates during the preseason. Next, I removed the worst remaining system using this year’s results. The value needed to get under 130.9, the top value for a standalone system.
Here are the results.
RMSE Value as Worse Systems Are Removed
Systems
RMSE
9
134.0
8
133.4
7
132.9
6
131.8
5
130.7
4
129.4
3
128.8
2
131.9
1
130.9
The three systems that had the best results are publicly available, Razzball, ZiPS, and Davenport.
With all that out of the way, here are the rankings using the full 223 hitters.
RMSE Values: All Players
System
RMSE
Post-Season Best
128.8
Aggregator #1
130.8
Davenport
130.9
ZiPS
132.4
BatX
133.5
Bat
133.6
ATC
134.3
Preseason Guess
135.1
Mr.Cheatsheet
135.3
Median
136.0
Razzball
136.2
CBS
137.8
ZEILE
137.8
Paywall #2
138.6
Average
139.3
Paywall #5
140.0
DraftBuddy
140.1
FreezeStats
142.6
Paywall #3
142.7
Steamer
142.8
Paywall #4
143.1
DepthCharts
143.9
Paywall #6
143.9
Paywall #1
144.8
ZiPS DC
145.1
Rotoholic
169.4
Mays Copeland
173.4
Before drawing any conclusions, here are the results without the hurt players.
RMSE Values: Hurt Players Removed
System
RMSE
Post-Season Best
112.1
Davenport
113.6
Aggregator #1
115.2
THE BAT X
115.5
THE BAT
115.6
ATC
116.1
Mr. Cheatsheet
116.9
ZiPS
117.4
Median
117.5
Preseason Guess
117.6
Average
118.5
CBS
119.3
ZEILE
119.3
Razzball
119.8
Draft Buddy
120.9
Paywall #5
121.9
Paywall #3
123.1
Paywall #2
123.6
FreezeStats
124.1
Steamer
124.3
DepthCharts
124.8
Paywall #4
125.4
ZiPS DC
126.0
Paywall #1
126.3
Paywall #6
127.2
Rotoholic
150.3
Mays Copeland
157.8
Like last season, the aggregated systems (e.g. ATC, THE BATs, Median, ZEILE) are near the top. The two projections that stand-alone are Davenport and ZiPS. Last season, they didn’t perform horribly but not good enough to stand out . Here are those rankings.
Note: I might be talking about Mr. Cheatsheet next year as a projection to target.
Both of them had a bad finish but they both were near the top at other times. For standalone playing time projections, they should be given consideration along with the aggregators and Razzball.
Since the playing time from ZiPS is separate from the other playing time projections here at FanGraphs, I asked Dan Szymborski, how he sets the playing for ZiPS.
So setting playing time by just knowing player traits is at least average and outperforms most projection systems.
I was not surprised to find that some of the factors helped predict playing time. While the short 2020 season has caused some hiccups, I found playing time projections could be improved by knowing a hitter’s previous playing (injuries), player talent (good players play more than crappy players), and age. My formula was just a 10% improvement, but still helpful.
What ZiPS is doing is pointing out factors analysts might be missing. For example, why does ZiPS have Gunnar Henderson at 557 AB and Steamer down at 531 AB? A system must be even lower on Henderson’s playing time and is dragging ATC down to 510 AB.
One issue with ZiPS is that it doesn’t robotically zero out playing time. There will be more plate appearances than available in a season. It’s not close to a perfect projection system, but it is definitely catching some factors other projections aren’t.
Here are a couple of issues I could see chopping into ZiPS’s high rank going forward.
It could just be a recent blip where analysts are still having problems evaluating playing time so near to the shortened 2020 season and the 2021 late start. Once baseball gets back to normal, analysts might perform better.
The other projection creators could start spotting their biases and make adjustments to correct them. I’m not sure about this change happening. I discussed ZiPS’s performance with two people behind the better projections and they blew off the ZiPS results.
It’s always I ton of work to set up these projection comparisons. As expected, the aggregators dominated again with a couple of single systems (ZiPS and Davenport) taking a step up this past season. It’s interesting that ZiPS performed as well as it did considering it has no human input.