Much like Hot Right Now, Cold Right Now will be a weekly Ottoneu feature with a focus on players who are being dropped or who maybe should be dropped in Ottoneu leagues. Hot Right Now will focus on players up for auction, players recently added, and players generally performing well. Cold Right Now will have parallel two of those three sections:
- Injuries: Players who are being cut because of IL stints.
- Roster Cuts: Analysis of players with high cut% changes.
- Cold Performers: Players with a low P/G or P/IP in recent weeks.
There won’t be a corresponding section to Current Auctions because, well, there is nothing in cuts that correspond to current auctions.
Roster Cuts
Jake McCarthy, Add% (-) Change (7 days) – 12.77%
McCarthy’s August batting average dipped down to .192 and even though he stole three bases in that time, he was a drain on points totals and roto standings. He was demoted to AAA on August 14th and in his five games played so far he is batting .273 with a home run, five RBI, and one stolen base. He has struck out five times as well.
McCarthy’s 2022 MLB K% was 21.5% and he has dropped his 2023 mark down to 19.2%. The league average currently sits at 22.7%, so McCarthy doesn’t necessarily have a strike-out problem. His OBP (.325) is above the league average (.320). Maybe he’s getting BABIP’d? Nope. His .305 BABIP is greater than the MLB average of .297. One of the biggest issues I can find is simply in McCarthy’s slugging (.331) which is way below the league average of .414. He isn’t hitting the ball hard and he is putting it on the ground often. McCarthy is proving to be a fairly average player in a crowded Arizona outfield who isn’t contributing much in the slugging department. Keep an eye on him in AAA while also keeping track of the current MLB Arizona outfielders (Tommy Pham, Alek Thomas, Lourdes Gurriel Jr.) and you may find an opportunity to buy low, which you would still want to do given his stolen base potential.
Paul DeJong, Add% (-) Change (7 days) – 12.46%
Traded to Toronto, then benched, then designated for assignment, then released, and now landing with the Giant, Dejong has had a busy few weeks. He has hit 13 home runs in 2023, but his batting average is a low .211, which is actually higher than the marks he posted in 2021 and 2022. Dejong will get another chance with the Giants, but their infield is crowded and I don’t see him contributing much besides possibly a bench role this season. Dejong has been the player he has always been in 2023, so no fantasy manager should be surprised.
Andrew Chafin, Add% (-) Change (7 days) –7.99%
Since being traded to the Brewers, Chafin has mostly played a middle relief role, but his move has not come with great success. His K/9 has gone down, his BB/9 has gone way up and his Brewers ERA sits at 11.81. Chafin just hasn’t had his fastball consistently this season and it has returned a -4.1 pVal (PitchInfo) in 2023, a career low. Chafin lost a tremendous amount of value when he moved away from Arizona where he could have at least recorded holds. In my opinion, he’s an easy drop in all formats.
J.D. Davis, Add% (-) Change (7 days) – 6.71%
With a 2023 first-half batting average of .277 and a career batting average of .261, many managers probably saw a second-half dip coming and it did, dropping (so far) to .167. Davis has had a solid season, but it has been more in line with all his other seasons in the past. The difference is that he has gotten much more playing time with the Giants than he did when he was with the Mets. Davis is the type of player whose xwOBA always looks good because of his ability to hit the ball hard and find the barrel. But, he’s been slumping in both departments as of late:
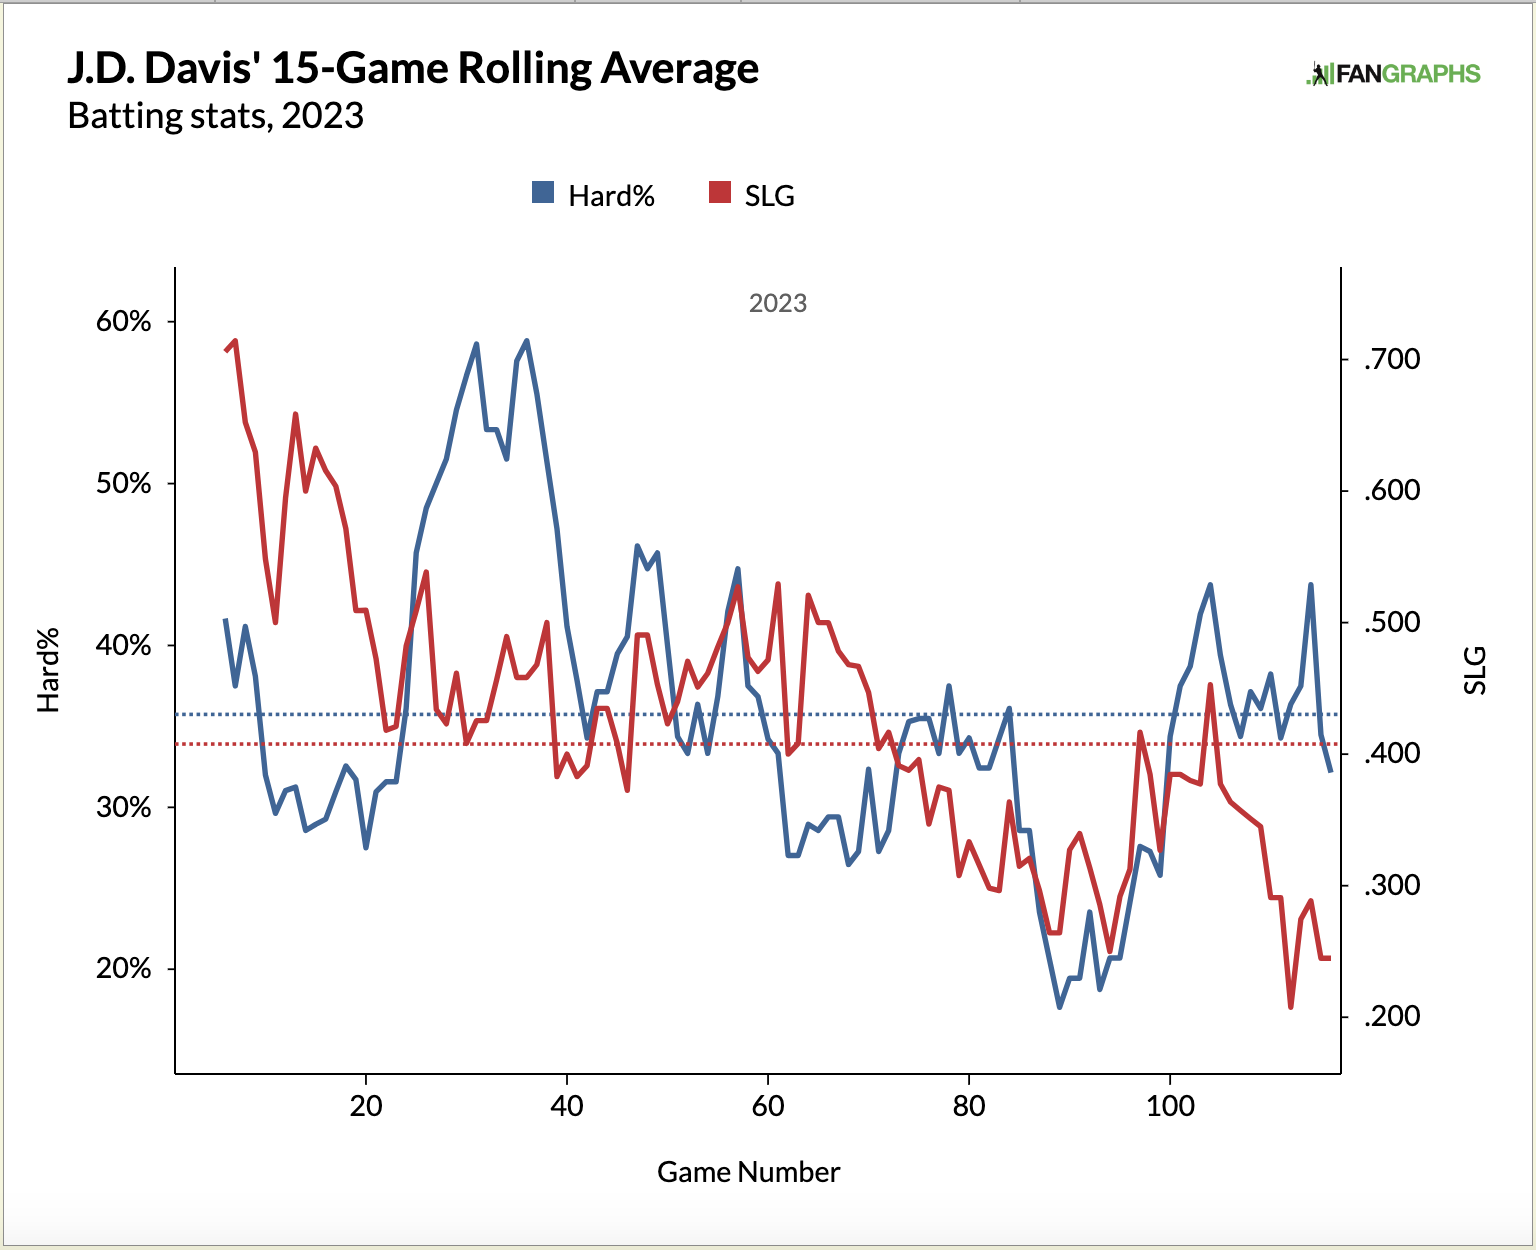
Notice, however, that while his slugging percentage has been trending down consistently, he has had a bump as of late in his hard-hit rate. Add to that the fact that his second-half BABIP sits at .230 and there might be reason to be hopeful about Davis moving forward. Part of the reason for this BABIP drop could be that his second-half ground ball rate has ballooned to 60%, so there are likely some swing adjustments that need to be made and should be paid close attention to.
Joey Wiemer, Add% (-) Change (7 days) – 6.07%
Among qualified hitters playing center field, Joey Wiemer has the fourth-best ultimate zone rating (UZR) and sixth-best “Def” mark. You would think that is likely to keep him in the lineup in Milwaukee, but Jeff Zimmerman recently wrote in his 8/18/23 lineup analysis that:
Joey Wiemer (vs LHP) and Tyrone Taylor (vs RHP) are in an outfield platoon.
Wiemer’s overall .213/.290/.376 slash line is not doing your fantasy team any favors. He was hyped in prospect discussion due to his ability to hit the ball very hard and while he is doing that in 2023 more than the average player, he is striking out way too much (27.4%). He is batting only .178 against righties, but he does have six home runs against them. His other seven home runs (13 total) have come against lefties. Match his 13 home runs with his 11 stolen bases and he’s still not a bad player to roster. At only 24 years old and a max EV of 112.8, I’m holding with the hope that he can improve his plate discipline (somewhat) as he matures as a major leaguer.
Cold Performers
To measure cold performers this week, I’m looking for players with low P/G or P/IP in the last 14 days.
Mickey Moniak, -1.09 P/G:
After an incredible May, June, and July, where Moniak hit above .300 in each of those months, he has finally cooled off in August and cooled off big time. He is hitting just .138 so far in the month. Overall in 2023, Moniak hit .307 against right-handed pitching and just .114 against left-handed pitching. While he has run a very high K% all season (35.2%), it has jumped to 47.5% in August. With Mike Trout back in the lineup, Moniak is likely a bench player for now.
Austin Slater, -0.92 P/G:
Slater has not had a hit in August in 23 plate appearances, which is wild considering he hit .366 in 43 June plate appearances. Roster Resource has Slater in a projected platoon versus LHP. His August K% has also swelled up to 43.5%. He’ll need to find his stroke again in order to be fantasy-relevant.
Tony Gonsolin, -3.40 P/IP:
Before hitting the IL with “right forearm inflammation”, Gonsolin gave up six home runs in two starts. The Marlins got him for 10 earned runs in his most recent start and he threw only 3.1 innings. He has given up at least one home run in each of his last eight starts. The outlook on Gonsolin is not good for the rest of the season:
Michael Kopech, -4.32 P/IP:
Kopech, like Gonsolin, has had unreal home run issues in 2023 and his last two starts have not deviated from that at all. He gave up four dingers in his last two starts and a combined 13 earned runs. His season-long HR/9 is now at 2.17, which leads the league among starters with at least 100 IP. With that same IP threshold going back to 2010, Kopech’s HR/9 ranks 8th place among starters. If you’ve been rostering Kopech this whole time, then I just don’t know.