A Response to a Diatribe Regarding Player Values
I don’t know if y’all are familiar with Tanner Bell. He recently joined the RotoGraphs staff and has wasted no time churning out quality post after quality post. He performs analysis, but he also offers technical advice regarding the “offline” components of fantasy baseball such as building cheat sheets in Microsoft Excel. It’s good stuff, even for people who consider themselves proficient in Excel — I do and, alas, it never occurred to me to conditionally format my draft prep workbook to strike out players already drafted.
Similarly, it seems Tanner recently experienced an epiphany (or two) of his own in regard to player projections and valuations. I mentioned to him I wanted to respond, so to speak, to his post, not as a criticism but as an expansion. A validation, I guess.
Also, rarely, if ever, do we engage in back-and-forth call-and-response posts. I don’t intend for this to be one of those. It’s just that Tanner inspired me, but I have some thoughts of my own to add.
My home league drafted Saturday morning. I really like my team, but !@*$ me, I left money on the table. Again. I did this last year, and I wrote about it. I thought it wasn’t so bad, but I was wrong. So very, very wrong. My team was pitiful. Excruciatingly bad. And while 22 separate DL stints played a culprit to my team’s putrid state, my draft — and, thus, my dumb self — must bear the brunt of the blame.
This time, I do really like my team, but I can’t help but feel like I missed out on a huge opportunity because I was too stingy during the bidding for one particular player, and it completely changed the trajectory of my draft.
Projections and valuations should be fluid.
Like Tanner, I used to be a dollar-value absolutist. Rarely would you catch me bidding even a dollar over a player’s projected value, let alone two. It’s an admirable approach — you maximize your earning potential by finding bargains — but it not only can completely suffocate your draft strategy but also represents a fundamental lack of understanding of player projections.
Again, this is no criticism of Tanner. I did this, too. I did this last year. But it dawned on me — frankly, it baffles me why it didn’t sooner — that because projections represent most-likely outcomes among a distribution of outcomes, so, too, do valuations based on those projections. In other words, dollar valuations of players represent a most likely value among a distribution of values. Much of this Tanner already established.
Alas, it’s only one thing to acknowledge the fluidity of dollar values.
Determine where, within each player’s outcome distribution, his projection lies.
This is, in essence, the same advice as Determine whether each player’s value carries upside or downside. The more nuanced version of said advice goes as follows:
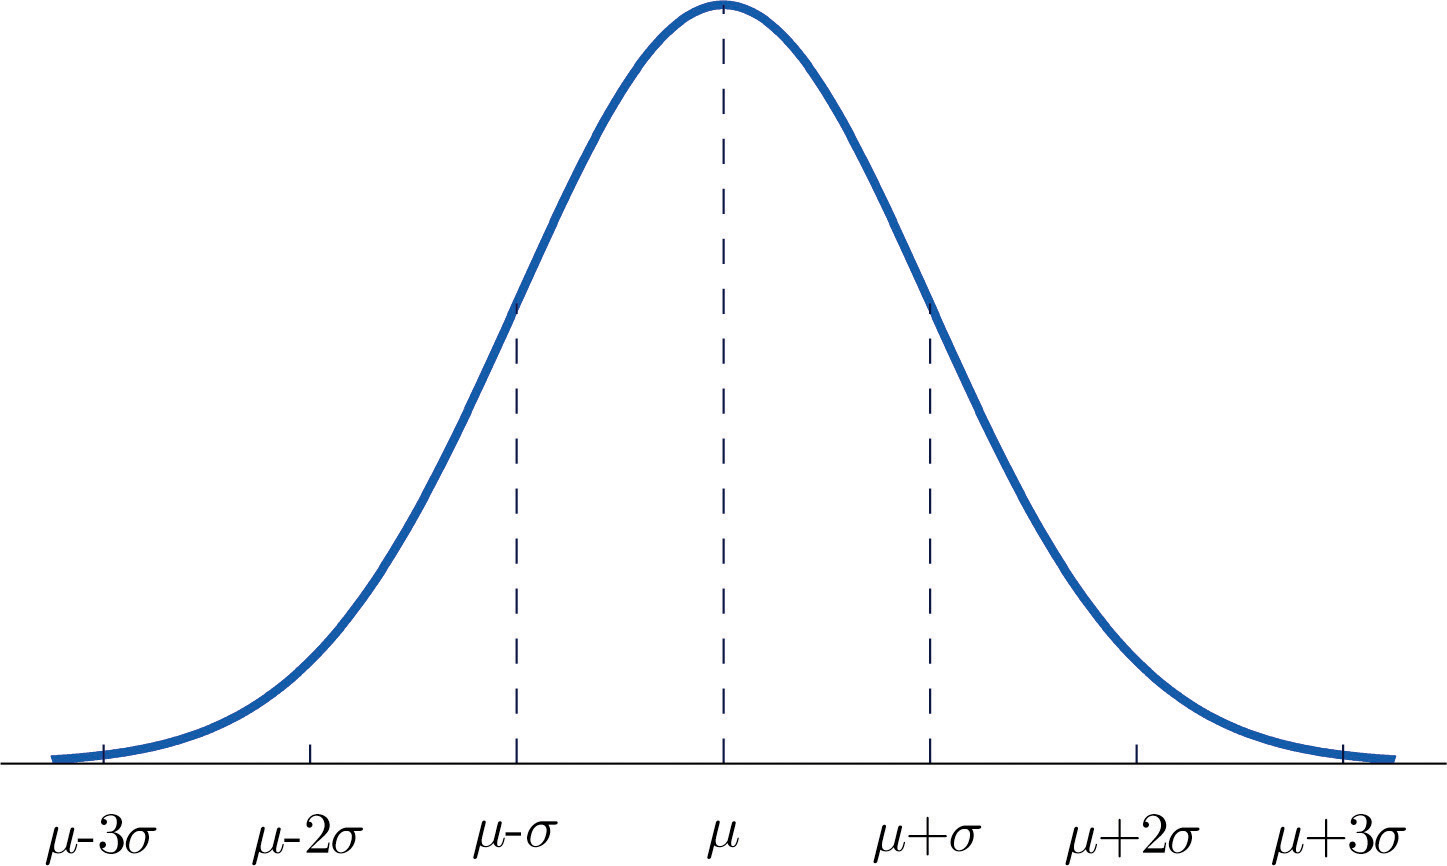
Player outcome distributions may not necessarily assume the shape of a normal bell curve. Some may be left- (or negatively-) skewed; others, right- (positively-) skewed. Moreover, the projection may not fall right at the mean (or average) outcome within each distribution; depending on the projection system, it might be a median projection, or perhaps it’s the most frequent, or mode, that emerges from an iterative process.
Unless a particular projection system tells you how this distribution looks or what value the projection specifically represents (Baseball Prospectus’ PECOTA technically does this, with percentage probabilities for growth and attrition), then you should consider making these determinations for yourself. Yeah — for every player. I know it’s time-consuming. And maybe you feel like you don’t really know how to make these assessments on your own — that’s why I’m using the projections, after all, you just muttered under your breath to me. If that’s the case, make use of the tools we write about here as best as possible. There are quite a few: xHR/FB, xBABIP, xK%, xBB%… the list goes on. Worst-case scenario, go by your gut.
Point is, at least have an opinion on every player and how well you think his dollar value (or ADP) captures his most-likely value, and how it compares to what you think his ceiling and floor could be.
Starling Marte has been my easiest target this preseason. FanGraphs’ Depth Charts projections pegs him for 18 home runs and 31 stolen bases, among other things. Essentially, it projects the same power output and more stolen bases (on more attempts). If you dig into his numbers, though, you see he accomplished his career-best home run total on his lowest ever hard-hit rate (Hard%) and fly ball rate (FB%). Moreover, Marte’s stolen base attempts have dropped off markedly every season, so expecting him to steal more often, at his age, is pretty bullish.
So, there. I’ve made some assessment of Marte’s projection. Relative to his average draft price/position, I think it captures his ceiling more than what has the best probability of happening. Thus, I think there’s very little room for profit and a lot of room for error.
In terms of “reliability”…
…not speaking in terms of statistical reliability, or what we might think of as “stability,” but a player’s reliability, or consistency, of performance…
Tanner covers this well. He shoots down the idea that a player’s reliability is “baked into the player’s projection” as a sensible one. This, again, all comes down to outcome distributions. The less data we have for a player, the wider his outcome distribution will be.
Bear with me, for this graphic is poorly construed.
The X-axis depicts dollar value, and the Y-axis depicts the frequency that a certain outcome will occur. In this situation, Player A (solid line) and Player B (dashed line) are projected for identical dollar values. Player A has been in the league and performing at an elite level for seven years; Player B, and the Carlos Correas of the world, debuted last year. Per their distributions, we see the probability that Player A will generate $X in value is significantly higher than Player B, even though it’s the most likely outcome for both of them. Player A’s outcome distribution is much tighter, too — at this point in his career, we pretty much know where his ceiling and floor are.
Player B, on the other hand, has a much wider distribution of outcomes. The probability that he outperforms Player A is high enough to think he’s the best thing since sliced bread. However, given he is an unknown quantity, the probability that he underperforms Player A is quite high, too. Theoretically, all of this volatility is baked into the projections, yes. But Tanner makes the argument (at the risk of putting words in his mouth) that you should be more risk-averse in early rounds, assigning a mental premium to players with tighter outcome distributions — in other words, the mor reliable ones. I support this notion, and all my recent ADP research seems to support it, too.
Value Versus Team Construction Versus Standings Gain Points
Tanner has written a lot about Standings Gain Points (SGP). Essentially, it’s a method of valuation that calculates, for each statistical category, the average difference between each team rank — say, between 1st and 2nd, between 8th and 9th, etc. It’s not exactly the average difference — the method calculates a line of best fit — but it’s close.*
(*This isn’t meant to pick on SGP specifically as a valuation method. I don’t know of any popular methods that aren’t non-linear; this one simply best helps underscore my point.)
This weekend, I made a stupid mistake: I marked Alex Gordon as kept by another team instead of Dee Gordon. This was a huge blunder, because I planned to draft two elite third basemen, outfielders, and/or second basemen. Again, it’s a keeper league, so I had in my crosshairs Manny Machado, Jose Bautista, Jose Altuve and Gordon. I passed on Machado when the bidding got too rich for my blood and bought Bautista. That left Altuve, on whom I eventually passed when the bidding passed my projected value by $3.
Except Gordon wasn’t actually available. The next-best second baseman left on the board was Robinson Cano, whom I won for $15 less than Altuve. I left $12 on the table.
A lot of this comes down to me being an idiot. But that’s not the point.
The point is Altuve was one of my best opportunities to buy speed at close to his market price. (Billy Hamilton went for way under his market price in this draft, and while I know it’s super trendy to hate drafting him, he will probably provide more value than his price for everyone who buys low on him. But I digress.) My team will very easily contend in home runs — in fact, the 20 or so that Cano will contribute to my team probably only net me two points at most in the standings.
However, in hindsight, Altuve’s could have netted me as many five points in the standings. This is my fundamental issue with SGP: it assumes an equal marginal (or incremental) value for every statistic. And this holds true for a bulk of the teams in a league. But it doesn’t capture the outliers very well. In fact, the outcomes in your league are also subject to some sort of non-linear distribution, and it’s likely the best and worst teams in each category are not subject to the SGP denominator.
Despite denouncing SGP, which I know Tanner employs, SGP actually helps make a perfect argument for balanced roster construction. I have borrowed the following image from Tanner’s web site, Smart Fantasy Baseball.
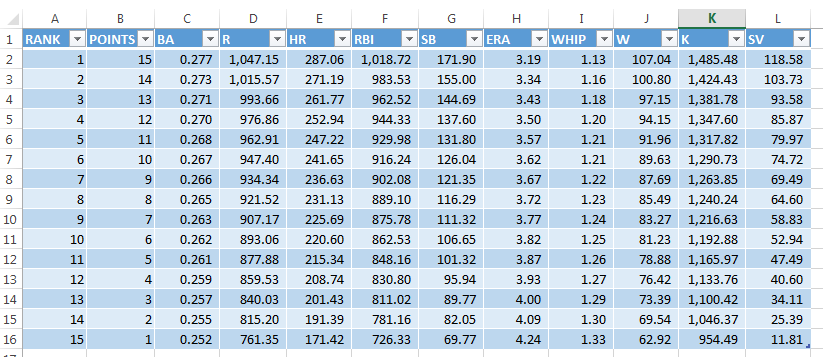
OK. Let’s consider Altuve’s 36 stolen bases versus Cano’s 17 home runs. Looking closely at the image above, Cano’s 17 home runs best benefits a team projected to finish in the middle of the pack in the category. For example, if the 9th-place team, in terms of home runs, drafted Cano, it could mean the difference of roughly three points — 225.69 + 17 = 242.69, enough to propel the team into 6th place in the category. Those 17 home runs are borderline useless to the very worst and very best teams, though; it does not help the first- or last-place teams at all, and the 2nd- and 14th-place teams barely gain a point in the standings from Cano’s contributions, on average.
Similarly, Altuve’s 36 stolen bases are enough to boost the 9th-place team in terms of stolen bases a full six points in the category (111.32 + 36 = 147.42, good for 3rd). If the last-place stolen base team drafts Altuve? That’s worth only three points, on average.
Accordingly, a team with the best chances of gaining — and also losing — points any particular category will be a well-balanced one. The smallest differences between teams within categories most commonly occur in the middle of the pack.
There are some moving parts here; obviously, when you draft a player like Altuve, early in a draft, you don’t really know how the marginal value of his contributions will affect your team. You’re still laying the groundwork for how your team will look, statistically speaking. But when you get deeper into the draft, you need to think more carefully about these things. Tanner’s example, of Carlos Gonzalez versus Gregory Polanco, is a salient one: Gonzalez may be worth a dollar more than Polanco, perhaps. But if you stand to gain more categorical points from Polanco’s speed than CarGo’s power, then it’s Polanco, and not CarGo, who is more valuable to you at that moment in time, even if he is worth less than CarGo in absolute terms.
So… what you’re saying is, it’s all fluid. Always. Forever.
Well, kind of, yeah. You just can’t be so rigid about things. You assign values to players, but those players could, and really should, change as the draft unfolds. You should assess the relative value of other, similar players, and you should assess the value of a player mid-draft relative to the value generated by those you have already drafted. Billy Burns ain’t gonna do jack for me if I already drafted Altuve, Gordon and Hamilton, even if Burns and speed is “worth more” than Khris Davis or Joc Pederson and their respective home runs.
So that’s it. It spiraled out of control into something much bigger and longer than I ever anticipated. I think Tanner will agree with most of it. I hope he would, considering I largely agree with everything he said. I even put words in his mouth, and I agreed with those, too. I just hope it’s wasn’t too redundant or unnecessary — I just hope these small clarifications and expansions were the least bit illuminating to those of you who made it this far, that’s all.
* * *
Post script: Steamer does have reliability estimates for its projections — they’re just not included on FanGraphs. You can view 2015’s reliability estimates here, on Steamer’s website — scroll left to column AD. The hitters with the highest reliability scores? Miguel Cabrera, Mike Trout, Andrew McCutchen, Freddie Freeman, Cano, Adrian Gonzalez… surprise, surprise. For posterity, Correa’s projections ranks 1,442nd in reliability among all hitters.
My personal solution was to start calculating dollar values with, say, 90% of the actual money available. It lets me stay strict with the Alex Gordons and the Evan Longorias of the world but lets me have a petty cash box to splurge when I feel a premium is appropriate. This may not work for everyone, but it works best with my understanding of my values.
Hallelujah!! You and Tanner and right on, and a refreshing read compared to all of the strict valuation advise out there. Keep it coming.
…are right on.
A note on reliability/volatility:
In most situations, it is actually rare that the higher-variance projection will have the same mean as the lower-variance projection. That’s because the less reliable projection will typically also more heavily weight a tendency toward player-average performance (i.e. what you’d go with if you had no other information about the player). So the mean will be dragged toward mediocrity.
That’s why the mediocre veteran will almost always project to a better “average” projection than the upstart risk-reward play. But the mediocre veteran’s upside is clipped, and it is often the tail of the distribution that wins in fantasy—though that depends on the league, and sport, and roster context.
This is where rankings/value projections and actual drafting completely clash. Rankings lists will almost always favor you to go with the David Wrights of the world in the late rounds. But that clashes with what you’re actually trying to do in those rounds, which is to find a higher-variance player who breaks out enough to actually be a contributor in your starting lineup.
Right! Really, I had hoped (but failed) to find an image where a tight distribution overlaid a negatively-skewed (and high-variance) distribution. Because, as you said, player performance is typically regressed toward the league-average, so the left tail would be much longer and the distribution not necessarily bell-shaped. If I hadn’t already written 2,000 words I’d just slap this comment into the middle of the piece, especially the last part of it, right around the moment I very briefly mention ADP.
Maybe you should stop being lazy and create your own graphics.
Shots fired!
Are 2016 steamer projections with reliability anywhere? I didn’t see them on their website.
Not sure — I didn’t see them there either. They might not be posted until after the season is finished.
This is why I hinted that they’re not easily available. I’ll start some conversations and see if we can’t get it published on the site somewhere.
But at the very least we can see the prior year ones that Alex pointed out. So we can start the research process now.
Say you have an early round choice between two players with equal projections.
If I am playing in a league where I know I am one of the better owners then the safer choice is the player I want. If I am in a league where I am in the bottom half of owners I want the guy with more variability.
If am in a league with equal owners, why would the player with a narrower distribution be worth more? It seems more a human nature thing rather than a numbers thing.
The narrower distribution is potentially more attractive because it gives you a more accurate estimation of what you have and therefore what you need. Take Chris Davis, for instance. If he hits 47/53 home runs then your team construction may tell you that any additional home runs would be surplus and therefore you should be targeting players whose value is concentrated in other areas. If he hits 26/33 home runs, however, you would have more of a benefit from additional home runs in the remaining player pool. Let’s say that you need a third baseman and you’re trying to choose from Nolan Arenado or Kyle Seager. Arenado obviously has the higher upside, yet in the two previous seasons Seager was worth significantly more and my money is on Seager being worth slightly more in 2016. Because Seager has produced incredibly consistent numbers over the last four seasons doesn’t guarantee that he will hit those marks again in 2016, but it does mean that he has less variance in his potential outcomes than Arenado, and therefore you have a better idea of what numbers your team is going to get out of that position.
I would argue that with higher variance players, the projections are accurate enough that you still know what you’re getting, just with less precision.
Also, the Arenado/Seager example is purely a hypothetical, right?
I don’t follow your reasoning. If there’s significantly less precision then you have significantly more uncertainty.
With the current state of projections, the X number of hitters you draft, and all the free agents you pick up, how much does the narrow distribution mean?
I still don’t know how you can take Arenado over Seager.
Because Seager was worth $5 more than Arenado in 2014 and $7 more in 2013. If Arenado maintains most of his power increase then he will be more valuable, but I am expecting ~25 home runs.
Here are some very conservative projections for Arenado:
15% K
5.5% BB
14% HR/FB
42% FB
.295 BABIP
630 PA
And here’s what that adds up to, approximately:
.286 BA
29-30 HR
Even if he regress to 25 hr, the only think Seager is better in is maybe 5 SB? Arenado has him by about 20 points in BA, and at least 10-20 R+RBI.
wilkel:
Those numbers are not “very conservative.” That BABIP would be just one off of his career high while the others are pretty much a middle of the road expectation, so conservative numbers would be somewhat worse than that. On HR/FB%, it’s worth noting that Arenado finished at 7.1% and 11.4% over his first two seasons, so ~13% would be a reasonable expectation.
OutOfTheBox:
Remember that Arenado’s monster R+RBI totals were greatly influenced by having the fourth highest home run total in the league, so if you regress the HR total then that’s going to knock his R+RBI numbers as well. He also doesn’t have the best OBP guys hitting in front of him, so I’m expecting a large drop in RBI.
Seager’s R+RBI has been about 160
Arenado R+RBI last year was 230
I don’t expect those numbers again but I don’t see how you cannot project Arenado to have more than 160 R+RBI. That with the 25 HR seems like you are projecting more of floor or that 2015 never happened.
Besides him not coming even close to that in either of his first two seasons, I am pessimistic regarding the quality of the Rockies’ lineup around him. Blackmon is solid but I expect LaMahieu’s OBP to drop by thirty points or more, while Parra is a downgrade offensively from Dickerson and we’d be crazy to expect 600+ PAs again from Carlos Gonzalez.
And 25 home runs obviously isn’t Arenado’s floor, as it would be the most he’s ever hit in a season besides 2015.
Regression and the Rockies’ lineup downgrade is going to drop by 75 R+RBI. He is a developing player growth is expected
Bryce’s Harper never came close to 2015 numbers in 2013 and 2014 so therefore he has to regress all the way back to those numbers. By that logic Kyle Seager = Bryce Harper
OutOfTheBox, you’re being ridiculous. That in no way represents my logic and suggesting otherwise makes you look quite petulant, especially because I’m obviously not regressing Arenado all the way back to his 2013/2014 numbers. I’ve been high on Nolan since his time with Asheville, so it’s not like I’m down on the guy, but I don’t think anyone ever expected him to hit 40+ home runs in a season. It’s fine if you disagree with my projection for him, yet my reasoning is sound.
The valuation questions are interesting and are one the main reasons I love rotisserie baseball while despising points formats. There is a general industry consensus about using value over replacement, albeit with some differences on how to calculate replacement levels and how to handle inflation, but as far as I know there isn’t one “correct” way to calculate value in ratio categories. How you determine value in BAVG, OBP, ERA, and WHIP will vary significantly depending upon your approach, and I don’t know that it’s possible to definitively say which one is “best.” So that’s an additional layer of value uncertainty to throw on top of differences in probability distributions.
Amen to “Roto > Points”!
I think points systems are better because:
1) outcomes, to me, are more realistic to actual baseball, assuming you use a broad range of categories and value the points for each category appropriately (I.e., weighted to reflect actual value in the real on-field game)
2) roto outcomes suppress differences in standings — a team that hits 25 more home runs than the next closest team over a season will likely have a significant win advantage; in roto, you get one point.
3) roto significantly overvalues several statistical categories that have less real world value — stolen bases, wins, and saves; and, ratio categories can understate true differences in performance (WHIP in particular is often “bunched”).
I am admittedly biased, but I play in a deep mixed points league (it is not head to head), and it is remarkable how well our point structure reflects the real game.
To me, roto ends up having more “game the system” work, versus a well thought out points system.
It seems many of us prefer low variance players in the early rounds. I believe the thinking is that you have more to lose, and therefore the cost of undershooting the projection is greater. I’m not so sure, however. Take the obvious example, Correa. Here are some hypothetical “true talent” projections and dollar values for him in 2016:
Low: .260/17/70/70/17 – $25
Middle: .270/22/79/79/20 – $32
High: .280/27/87/87/23 – $39
I think it should be clear that, as long as you’re paying for the most likely outcome, and not the upside, then it is fine to take a player like Correa early/ at a high price. In the above example, sure, you’re fairly likely to lose out on $7 of value, but that is counteracted by a similar chance to gain it back in upside. The main point of this might be that upside still exists and matters in the first round.
Also, I’d like to add that the real reason upside matters more in the later rounds is because those players literally have no downside (or at least very little). Their downside is simply whatever the replacement level is. If Marcell Ozuna fails to hit for any power and strikes out 27% of the time through the first month and a half, you can just drop him without worry. Another example is Ryan Zimmerman, whose downside is his injury risk. If he goes down, it’s no problem; you can just pick up a replacement, so the injury risk actually matters very little to begin with.
Personally, I aim for some combination of elite production + a high floor (aka low variance) early on and, yes, maximize the crap out of my potential earnings with cheap, high-variance, potentially high-upside guys at the end, especially in keeper/dynasty formats. Which is a long way of saying, yes, I agree. 🙂
I love your Correa example. I really, really want to be anti-Correa. And I don’t want him valued as a first round player. But when I look at the numbers and do a basic projection and dollar calculation, I can’t see how he’s not. It’s against every bone in my being… But I’m with you.
And I was being a bit cliche by saying “avoid risk early”. I think balance of risk is more important. If you want to be risky in the first round, I would balance it out with stability later.
I think Tanner has said in the past that you should not draft based on SGP alone for the reasons you kind of outlined. SGP are simply there as a way to help compare the different categories because without using it (or any other method that compares categories) it’s pure guesswork on who should go when in a draft. Without putting a $ value to what a HR or RBI gives its basically impossible to make logical values.
Some people stick to the “never go above your value” method but it’s rare. I think most just have the value as a guideline for overall values of players that are within a range of $2-3 for upper tier players and $1-2 for lower tier guys.
Right — Tanner’s a smart dude, and I didn’t mean to oversimplify the SGP approach at all. But I think it can be sometimes.
I think the “never go above your value” approach is more common than you might think, but that’s also completely anecdotal. I have no idea how other people approach valuations, to be honest. I’d love to see what a survey turns up, but I feel like some people guard their strategies like Joey Votto might guard his two-strike approach.
I guess if you do your own projections, it’s okay to stick strictly to your valuations? 🙂
This all, and what Tanner said, makes sense, if you’re using a valuation system like Steamer. Obviously, you’re not going to agree with every projection and so whatever value it spits out, you might personally think the player will perform better or worse and go the extra buck or reduce your bid. But that seems pretty obvious. If you manually project players, there’s little reason to bid beyond your value, unless you screwed up, or the league is overvaluing a certain subset of players and you can’t risk being shut out without overpaying (but do so to a lesser degree on a relative basis).
For a lot of players I project — especially the prospects, rookies, sophomores, and so on — I error on the side of caution, or undervaluing them. I tend to be risk-averse, so it’s a lot easier for me to identify if I want to buy one when the bidding is still hovering near a value I think is much lower down on their expected range of outcomes. And it builds in a little bit of room to go higher on them if I’m feeling bullish. So, from a nitpicky perspective, I technically do overbid my own values sometimes, but it’s by design. 😉
Even if you do your own projections, are your “values” the most likely outcome or are they “bid limits”? If you think the most likely outcome is $10, but you think there’s some upside or positive contextual factors, maybe your bid limit is $12. Then I think it makes sense to stick strictly to your $12 limit. But that’s not the same as sticking strictly to your valuation.
JR: it’s what I think is the “most likely outcome.” Rarely do I project a player at his ceiling; if I did, his value would kind of become a bid limit by default. (Or, in other instances, where I’m wary of age, injury, or other risks, I will treat the dollar value as a bid limit kind of by default. But, generally, no.)
What I think is happening here, and I didn’t necessarily start out with this direction in mind, is that Alex and I are starting to wonder if and how we should be using the fact that projections represent a range of outcomes.
Just like you don’t project “home runs”. You’ve got it broken down into FB%, K%, PA, HR/FB%, etc.
Could we benefit from breaking “projections” down into low range, mid range, high range, variability, reliability, etc.?
This is something I don’t do but definitely considered doing this year, especially after reading your post. It’s a lot of extra work, but having a nice min-avg-max setup would be really helpful when making split-second decisions.
I’d check out this website for some inspiration on how to provide both projection and an estimate of variance: http://fantasyfootballanalytics.net/2015/12/running-back-wide-receiver-gold-mining-week-17.html
Hey Alex — I think two things, if plausibly available, would be:
(1) Variance / average margin-of-error for each projection system. That is, if we know on average that Steamer varies ~15% with what actually happens, this can be useful when putting together an idea of how much you can “overpay” for certain players you like.
(2) As you mentioned, a confidence interval of sorts for each player suggesting their possible range of outcomes. Currently I combine Steamer, ZiPS, ESPN and TG and take the 20-80th percentile and consider that my likely range of outcomes/values for that player. This is a rudimentary (and possibly dangerous) stab at creating a confidence interval for any given player.
I think if we had an idea of how much a projection system varies and a possible range of outcomes for each player, that would give us a useable range of values and could help give a better understanding of how much you can “overpay” for certain players.
*Note: I am by no means a statistician, so please don’t crucify me for my loose (and probably wrong) use of various terms.
No crucifixion here! Margin of error and confidence interval estimates would basically be the same thing. Confidence intervals are calculated using standard deviations from the mean, and variance is the square of the standard deviation. The tighter the confidence interval, the more “reliable” a projection would be — in other words, having one would give us all the information we need. But the short version of the response to this: I wholeheartedly agree!
Alex –
I like where you started on this post but then I think you jumped the rails with the ‘variance’ stuff. Yes, certain players are more reliable than others. Balancing upside w/ reliability is a variable worth considering for a draft but it is not the rationale for loosening your bids.
I think it’s worth taking a step back and considering:
1) What do I really want to achieve with my draft? Is it pure maximization of my projected value? Is category balance important? How much do I want to balance upside/risk with reliability? Are certain categories more important to secure with your high picks? Is drafting a team that fits well with my in-season strengths important?
2) Which subset of players do I really have to research further to feel comfortable pulling the trigger? Yeah, ‘every player is worth a price’ and there are guys where you ‘can’t pass up on the value’ but there is no law saying you have to be a slave to it. Your Marte analysis was solid but it was only really worth doing if your projected price on him was higher than whatever proxy you used to estimate your draft room. If you had him priced lower than the ‘room’, no reason to dig any further.
3) Which top players am I fine paying ‘retail’ price or even $1-$2 more? Maybe none. But it’s best to be the guy making the ‘full’ price bid than the guy $1 less who then gets exasperated when someone bids them up to your limit.
4) How is the market pricing positions and categories? If they are high for a certain position or category (e.g., HR/power), do I want to allot more $ towards it knowing that other positions/categories must be then going at a discount?
I’ve found that my drafting has gotten more effective over the past couple years after I asked myself some of those questions and adjusted my valuations to match my strategies.
Just my two cents –
Rudy
Rudy! I appreciate the feedback. The discussion about variance was, more or less, meant to be educational rather than instructional. Accordingly, I definitely oversimplified some critical components of what could be a much deeper discussion to communicate a larger point. I did so mostly because there are a lot of moving parts to not only pre-draft strategy and valuation but also mid-draft strategy and (re)valuation — and you highlighted a lot of these. From knowing who you want to go big on, to where you want to spend your money (and when), to how certain positions are being priced prior and during the draft — these are all part of a can of worms that I was a little reluctant to open given my word count/sanity at the time.
With that said, I don’t disagree with anything you said here. In fact, I think we’re pretty much entirely on the same page. I would mostly lump it into this line, which I kind of mention in passing: “[…] you should consider making these determinations for yourself. Yeah — for every player.” In essence: do your research.
Looking forward to continuing this conversation sometime! Glad you dropped in.
Cool. Good luck in 2016!