2021 Projections – How the Experts are Handling the 2020 Season
Introduction
On June 23, Commissioner of Baseball Robert D. Manfred, Jr. announced that Major League Baseball would begin its 2020 regular season on July 23rd. It submitted a 60-game regular season schedule for review by the MLB Players Association. The proposed schedule featured divisional play, with the remaining games being played against their opposite league’s corresponding geographical division.
That 60-game proposal came to fruition. It was an unusual season to say the least. The St. Louis Cardinals did not play a game from July 30th through August 14th. Doubleheader games were all seven innings each, and extra innings started with a runner on 2nd base. The designated hitter was in effect for the National League, and so on, and so forth. In the end, the season came and went, and the Los Angeles Dodgers were crowned as champions of the Fall Classic.
Now we are squarely in the midst of the baseball offseason. Most fantasy baseball players are on holiday from their annual game, eagerly awaiting one of the most important ingredients to their annual draft preparation …
Projections.
For many (including myself), player projections are the backbone that form the strategies and planning for the upcoming fantasy baseball season. Understanding how player statistics are forecasted for the coming season is the essential part of fantasy preparation.
Let’s talk a bit about projections.
In its simplest form, a projection is a forecast about the future. A baseball projection is the best estimate of a player’s true talent for a given period of time.
As an actuary, I am used to formulating projections. An insurance projection is an estimate of a portfolio’s assets and liabilities over a given period of time. Insurance loss projections are made by studying historical claims, and developing a mathematic formula to capture its inherent volatility. By studying the past (using large samples of data), we can make an inference on how a group of policyholders (a portfolio) will incur loss.
In concept, baseball is no different.
There are three main elements of any well-designed baseball projection system:
- Regression to the Mean
- Aging Curves
- Weighting of Years
The essentials of a baseball projection system understand that an outsized performance – either better or worse than a player’s true talent – cannot sustain in the long run. Any reasonably good projection system knows that a player’s ability at age 40 is almost always worse than the same player at age 36. Finally, any valid projection system realizes that historical player performance is indicative of future performance – with the most recent season being more characteristic of true talent than any year beforehand.
I want to focus now on the final element – the Weighting of Years. The exact formula detailing how much weight to attribute to each prior season is something that defines the model.
What I mean by the above is as follows:

Take the made-up generalized XYZ Projection System. In 2015, the model incorporated 50% of 2014 stats, 30% of 2013 stats and 20% of 2012 stats. For the 2016 season, XYZ no longer incorporated any 2012 stats – but instead weighted the 2015/2014/2013 seasons with the same 50%/30%/20% weighting. For each following season, the weighting scale simply shifts over one more year to preserve the 50/30/20 ratio.
Another way to look at XYZ’s weighting formula would be:

Or even more simply …

The definition of XYZ’s historical seasonal weighting is 50% for year Y-1, 30% for year Y-2 and 20% for Y-3.
Now of course, the above is an extreme generalized rule. Some projection systems use 4 years’ worth of data, and some use MLE stats. For certain players who changed their batting launch angle at a point in time, perhaps the projection system will further discount stats prior to the change. A mid-season injury might affect the exact weighting for a particular player, etc.
Notwithstanding individual exceptions – the system’s weighting formula (with all else being equal) stays intact from season to season.
Since 1996, each Major League Baseball team has played 162 games per season. The player strike of 1994-1995 was the last time that the full season was not completed. Most of the currently available projections were not in existence (at least in their current form) at that time. For the past twenty-four seasons, 162 games were played year in and year out [aside from a random late season rainout]. The projection models have established their own system of weighting seasons, without interruption.
Enter COVID.
Everything changed in 2020. The 60-game season wasn’t even half the length of a standard season. A number of players opted out entirely of playing this year. The minor leagues were completely shut down. Statistically, 2020 was a major disruption for projections.
Today’s article will discuss how the experts intend to handle the 2020 season for the purpose of projecting 2021 player performance. The science will be the same, but the mathematics must change. The credibility of 2020 is the chief question that must be answered at the outset.
The fantasy baseball community, heck the entire baseball community at large – is waiting for the answer on how best to project the 2021 season. As someone who looks at a large number of projections, I felt that I should be the one to at least foster this debate.
The accuracy of 2021 projections will undoubtedly be worse than the accuracy of other season projections. With a smaller sample size of the most recent data set, the errors surrounding statistical deviations will be larger. Our goal (as always) is to minimize process risk, even if the parameter risk is inherently larger.
The Experts

I believe in the wisdom of crowds. I believe that listening to a wide range of smart people is the optimal way to learn and to grow.
For today’s article, I have enlisted the assistance of eight fantasy baseball industry experts. These eight individuals have created excellent projection forecasting systems. These are not the same panel of projections that are included in ATC. Rather, these are all industry friends that I personally know and more importantly – whose opinions I greatly trust.
I sent out a questionnaire / survey to these experts last week filled with pointed questions as to how they will be (or are thinking about) handling 2021 projections. I would like to share with you many of the questions and their corresponding responses. With a wide range of top-notch industry experts, my hope is to understand the range of defensible opinions on these matters. I will also include my own take where I feel that I can add some additional value.
Below are the eight experts surveyed, along with their affiliation and/or projection system model (in alphabetical order):
- Derek Carty – RotoGrinders / THE BAT
- Jared Cross – Steamer
- Jeff Erickson – RotoWire
- Rudy Gamble – Razzball
- Ray Murphy – BaseballHQ.com / Ron Shandler’s Baseball Forecaster
- Mike Podhorzer – RotoGraphs / ProjectingX.com / Pod Projections
- Dan Szymborski – FanGraphs / ZiPS
- Todd Zola – Mastersball / The Zystem
Now let’s go through the survey questions, the panel’s responses, along with my additional commentary.
Weighting of Prior Seasons
Question 1 – In order to take the 2020 year into account, how will your projection system change to reflect the shortened season, or will your projection system operate in the same usual manner? Please describe. Will 2020 be counted as is, or will it first be effectively scaled up to a 162-game [or other] level?
- Jared Cross (Steamer) – It will operate in the usual manner. It [Steamer] is used to handling players who have more or less information in recent seasons for whatever reason and has always been indifferent about why we have less information on those players. So, for the most part, we just turn the crank, and the system works as usual. The 2020 will be counted as is and will not scaled up.
- Rudy Gamble (Razzball) – I rely on Steamer to determine the proper weighting for rate statistics. Steamer and I are almost always in agreement on these things. My general point of view (which I haven’t vetted yet with Steamer) is that 2020’s weight should be scaled down to something along the lines of 2020 and 2019 having the same weight. My first inclination was to weight based on games played which would actually have 2019 counting more than 2020. But there is a diminishing return curve on games, and that the learnings from 60 games is greater than 60/162. A standard season would be worth 1.67x as much as the previous season. My gut belief is that it should be 1x, which would be the equivalent of a 100-game season in 2020. There is no need to scale up 2020. Focus on the rates vs. volume.
- Mike Podhorzer (Pod Projections) – Since my projections are created 100% by hand, instead of by a computer model, I do not explicitly use a previous season weighting system. I analyze the underlying skills driving the metric I am projecting (for example – if forecasting batter HR/FB rate, I analyze pulled fly ball rate) and try to discern the player’s true talent level. Instead, I simply identify the outlier seasons that should be discounted. For one metric, I might place more weight on 2018 performance, while for another metric – I might weight 2019 performance more. Aside from fewer games, the 2020 was crazy for many other reasons. For 2021, stats produced in 2020 should be assigned far less weight than a typical prior season weighting, but should not be completely ignored, as skills growth and deterioration certainly did occur. Unfortunately, there is no blanket percentage the season should be weighed, as it will differ depending on the player and metric I am projecting.
- Todd Zola (Mastersball) – I am using a fourth season (2017). The weighted average for the four seasons will be adjusted a bit. 2020 is counted as is.
- Ray Murphy (BaseballHQ) – We have revised down the 2020 weighting in our projections model. We use a 5-year model, not 3. Within that 5-year model, we are only weighting 2020 at 30%.
- Jeff Erickson (RotoWire) – I’m trying to play it as straight as possible. Typically, the most recent sample should be given the most weight, but then you have so many positive and negative outliers that it makes that set hard to rely upon. For instance, Jose Iglesias hit .373 in 142 at-bats. The universe didn’t have time to correct itself. But how much should I discount that performance? It’s impossible to be completely objective about it – really anytime, but I feel like the level of subjectivity will increase with this set of projections. The 2020 stats will be scaled up first – but there are dangers inherent there, particularly with young players and players who missed time due to injuries.
- Derek Carty (THE BAT) – I have not finalized the weights yet. However, scaling up should be unnecessary if you are also weighting by plate appearances.
- Dan Szymborski (ZiPS) – From 1981-1982 projections and 1994-1995-1996 projections, I found that the best approach was to make in-season projections for the “rest” of the games and then go about normally otherwise. Once these adjustments are made, then 2020 will be considered normal. The error bars are likely to be larger, but I don’t think it will result in bias in a particular direction.
First, we need to understand [numerically] the possible range of weights to be considered for 2020 in a generalized season weighting model.

Consider the standard season weighting in the XYZ Projection system from above. In the 50/30/20 model, the previous season would get 50% credit. For 2020, the season consisted of 60 games – which is approximately 37% of the normal year allotment (60/162).
In projecting 2021, if we fully adjust the credibility of 2020 by the proportion of playing time in the short season – the 2020 season would end up receiving 27% of the total weight. 2019 would receive 44% of the weight, with 2018 ending up with 29%.
The 27% figure that I state is a key figure. For 2021 projections, it represents the minimum weight to apply to 2020 statistics. No projection system will be using a lower figure. On the top end, projections would not surpass the standard 50% weight. Certainly, the short season is not more credible than a full 162-game affair.
The range of weights for 2020 will be somewhere in between 27% and 50%.
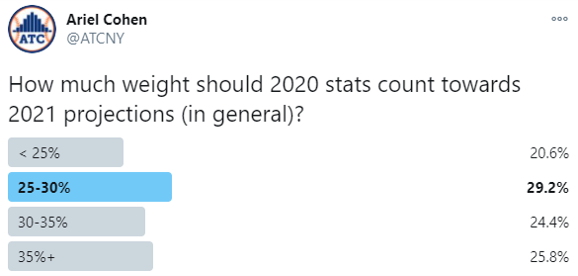
My Twitter followers were awfully split on the credibility to apply to 2020. Perhaps this was the result of the general nature of the question, but almost half of the responders suggested a figure on the lower side.
If I have interpreted the expert responses correctly, Steamer and ZiPS are on the low end of the possible range as well. BaseballHQ is close with a 30% figure, with THE BAT also right around that level. Since Mastersball is using a fourth season, I also expect them to come closer to the lower end of the range.
The Pod Projections and RotoWire Projections, which are manually generated by Mike Podhorzer & Jeff Erickson (respectively) – should exhibit an average weighting of 2020 much closer to the 50% mark as opposed to the 27% mark. Typically, unless there is a reason to the contrary (luck, injury, etc.) manual inspections will be more heavily tilted towards recent data.
Rudy Gamble’s comments are interesting, in that he typically follows the Steamer approach for his Razzball projections. But his remarks explicitly suggest a different weighting. If you work out his 100-game math, he suggests counting the ‘20 season as much as ‘19, producing a 38% overall weight to 2020.

I tend to agree with Rudy’s general concept, in that the 2019 season should not count largely more than the 60 games of 2020. Skills can improve or decline with time, and simply weighting by plate appearances would not give enough credit to a player’s change in skill. While I wouldn’t count 2020 as a 100-game season, an 81-game affair (half-season) might be more appropriate.

If we let 2020 count as a half-season (81 games instead of just 60), the math produces a 33% weight … an elegant one-third figure! For those looking for a starting point, I would suggest crediting 2020 rates with a 1/3 multiplier.
Question 2 – Will your weighting differ depending upon the statistic? For example, will you give more credit to 2020 for walks as opposed to homeruns? etc.
- Mike Podhorzer (Pod Projections) – Yes, as discussed in the answer to the first question. It is worth nothing that some stats “stabilize” more quickly than others and therefore a 60-game sample will still be enough to convey meaningful information. Other stats take far longer and need to be completely, or almost completely, ignored (like BABIP).
- Todd Zola (Mastersball) – Globally, everything is the same. Individual players are subject to change as I see fit.
- Rudy Gamble (Razzball) – This is a fantastic question. Steamer does weigh different per stat so would expect this to be the case for stats that stabilize quicker/longer.
- Jared Cross (Steamer) – Yes, but this was true in past years as well.
- Jeff Erickson (RotoWire) – Does it usually differ depending on the statistic? Did we weight homers hit in the Happy Fun Ball Year of 2019 any different than those of 2018 when projecting the 2020 season? So … yeah, it probably will differ a little bit.
- Dan Szymborski (ZiPS) – In this case, no. In-season projections already consider different stats in a manner which (hopefully) will account for this.
- Derek Carty (THE BAT) – Weighting should always differ based on the statistic.
As Mike Podhorzer stated, individual statistics stabilize with different sample sizes. Way back in 2007, Russell Carleton published an article showing exactly that. His article was subsequently republished on FanGraphs in 2011.
In a typical year, most statistics are beyond the threshold for full credibility, assuming full playing time. In a partial season, the credibility for each statistic varies. Strikeout and walk rates stabilize fairly quickly, while batting average takes a lot longer. The quicker a statistic stabilizes, the much more 2020 would have been in line with what would have been a regular full season.
For some stats, you might want to include 2020 rates nearly as normal, while others should receive far less weight. The above Question 1 focused on the general discussion of how to discount 2020, but do realize that projection weights are far more complicated.
Adjustments
General Question – Aside from the general projection methods above, what will your projection system do differently to adjust for the short 2020 season?
Question A – Will you incorporate 2020 playoff statistics?
- Jeff Erickson (RotoWire) – I think at the very least for the Dodgers, Braves, Rays and Astros, you have to look them. Isn’t this the Randy Arozarena question? It’s similar to K-Rod’s debut. It’s a thing that happened, and we don’t have much else data from 2020 to incorporate.
- Mike Podhorzer (Pod Projections) – I have never incorporated playoff statistics as the competition does not mirror regular season competition. I have no plans to suddenly start doing so now.
- Ray Murphy (BaseballHQ) – Not globally, but we may make revisions to individual players (primarily those who have larger sample sizes of playoff data).
- Todd Zola (Mastersball) – No.
- Jared Cross (Steamer) – No.
- Rudy Gamble (Razzball) – I do not think this is a good idea.
- Dan Szymborski (ZiPS) – I always use playoff statistics adjusted for level of competition.
- Derek Carty (THE BAT) – Ideally, and I would like to if I have the time to. But one has to be careful to adjust for playoff context properly.
Most of the panel answered no to this question. ZiPS was on the opposite end. Others are thinking about doing so.
It is hard for an actuary to decline the use of more data. My answer (in almost any line of work) would almost always lean towards incorporating extra available data, where possible.
In a normal season – I would tend not to want to include postseason statistics. We are predicting regular season baseball here, not postseason. The two aren’t the same statistically, despite the fact that both arise from games played on a baseball diamond. In the playoffs, player usage is quite different (especially in recent years), the competition level isn’t on the same level, pitchers may increase their velocity, etc. At best, adding on the few extra postseason games might just create extra noise.
In 2020 – this may not be the case. The Rays rayed all season long [yes, ‘rayed’ is now an official baseball word]. The Dodgers also operated in an un-orthodox manner for most of the season. The regluar season style of play was more akin to the postseason than in any other year to date. Playoff data on top of just 60 games might create more statistical stability for 2020.
Yes (as Derek and Dan suggest above), playoff data would have to be adjusted for context. Yes, I wouldn’t give ‘20 playoff data full credibility as compared to ‘20 regular season data. It may be somewhat analogous to including MLE statistics for players who are promoted to the big leagues mid-season.
If you can correctly adjust for context, my preference would be to include 2020 postseason data, though at a lower credibility level. There isn’t a precedent for this – so for the time being, use the old actuarial trick of 50%. Consider adding in playoff stats [context adjusted] at half value.
Question B – Will you credit players who overperformed more / discount bad performances less?
- Ray Murphy (BaseballHQ) – Once again, not globally, but even beyond that 30% weighting of 2020, we may individually tweak to further discount outlying performances in 2020, depending on other factors (injury, age, supporting skills, etc.).
- Mike Podhorzer (Pod Projections) – Every player’s underlying skills are analyzed and projected, so rather than crediting or discounting the player’s entire performance, each metric will be evaluated independently to form a conclusion. As an example, instead of deciding to discount Gleyber Torres’ bad performance less than I credit Teoscar Hernandez’s good performance, I take it one metric at a time and eagerly wait as the player’s fantasy line is calculated from my rate metric projections. As answered in the first set of questions, the sample size of the 2020 season, weird circumstances, and the player and metric in question will all help determine how much weight to place on 2020 performance in that particular metric.
- Jared Cross (Steamer) – No, in the sense that 240 PA in 2020 will be treated the same as 240 in 2019 was a year ago. Of course, a full season in 2020 carries less information than a full season has in the past.
- Rudy Gamble (Razzball) – This is something I would do qualitatively in player ranking just like I would do in standard years.
- Jeff Erickson (RotoWire) – I’m trying to lessen the extremes on both sides.
- Dan Szymborski (ZiPS) – Not in the system, though the unusual circumstances will always be in the back of my mind when using projections.
- Derek Carty (THE BAT) – I don’t see any reason to credit overperformance more, but it’s possible I will discount bad performance less.
- Todd Zola (Mastersball) – Globally, no – but maybe upon individual inspection.
The projection experts are not changing their methodology in this area. The manual projectors will still project as normal, looking at extreme situations with a more careful eye. The automated/formulaic projectors will by and large use their 2020 adjustments as is, which already reflects the variability of the small 2020 sample size. Aside from adjusting a few individual players, globally – they aren’t making such corrections/adjustments.
What I found interesting in some of the responses (especially from Rudy and Dan) is that although they may not change their projections outright, their player analysis might be influenced by 2020 overperformers/underperformers.
From a fantasy perspective, if you (at home) believe that adjustments are needed on top of the standard projections, you should either:
- Alter the projections as you see fit, and then form your valuations using the adjusted data to garner league context.
- Leave the projection set alone, and develop a mechanism to risk-adjust the valuation pricing to reflect the associated risk.
For the modeling of the ATC projections, I would rather that the experts leave their algorithms unchanged, so as to keep ATC’s weights more credible and in-line with how projections behaved historically.
Question C – Will you give more credit to long-time veterans? Less credit to rookies?
- Todd Zola (Mastersball) – Each is considered individually, with track record one of the factors.
- Ray Murphy (BaseballHQ) – Not as a class, no.
- Jared Cross (Steamer) – No.
- Rudy Gamble (Razzball) – I think ‘bouncebackcasting’ always leans towards veterans because you are banking on proven skill. Concerns about ‘over the hill’ definitely flood one’s mind thinking about a JDM vs. Baez. It ends up being a case-by-case basis.
- Dan Szymborski (ZiPS) – Not directly, though the indirect result of there not being a minor league season will cause this to happen.
- Derek Carty (THE BAT) – Unlikely.
- Mike Podhorzer (Pod Projections) – There will not be any blanket more credit or less credit, as it depends entirely on the player and metric that I am evaluating.
- Jeff Erickson (RotoWire) – That sort of depends. Did said long-time veteran lose 2 MPH on his fastball? If so, I am less inclined to give him credit.
The consensus of the crowd is that the number of years in the league will not be a factor for projections on the whole. However, I do agree with Dan Szymborski in that there will be an indirect effect present as a result of the short season (with no minor leagues).
Question D – Will there be any changes to the way rookies/prospects will be projected?
- Mike Podhorzer (Pod Projections) – Nope.
- Todd Zola (Mastersball) – No.
- Jared Cross (Steamer) – No.
- Rudy Gamble (Razzball) – No.
- Dan Szymborski (ZiPS) – No changes to how the projections are made. Sadly, they will just be less accurate
- Derek Carty (THE BAT) – They will have more variance without an MiLB season or any data whatsoever for them this year. Unfortunately, there’s nothing we can do about that.
- Ray Murphy (BaseballHQ) – In general, I think for prospects who did not play at all in 2020 – you have to assume some level of rust entering 2021.
The experts across the board answered no to this question. Rookie/prospect projections will entail a larger amount volatility than in a typical season. Of course, rookies/prospects already are more variable than the veteran players.
The question is – how much additional risk should be associated with rookies/prospects, and how much risk will the market price in. The astute evaluator will determine what that drop in price should be, and will compare it to what the market is doing. Yes, there is a possible profit potential lurking here somewhere. Always look for these opportunities.
Of course, I will also remind you that you do not need a prospect to win a fantasy league. Saves and steals are categories. Prospects are not. But for 2021 in particular, I can envision an outstanding prospect becoming a major contributing factor for a fantasy team’s triumph. Don’t simply write them off due to increased variability. [As an actuary, we make our money by understanding risk – not avoiding it.]
Question E – What are any other notable changes/adjustments [related to the short season]?
- Ray Murphy (BaseballHQ) – We are looking at a “2nd half 2019 + 2020” split as somewhat instructive, especially for younger players. It is not directly factored into the projections, but we’re presenting it as a stat line in the Baseball Forecaster.
- Todd Zola (Mastersball) – I added a quality of opposition adjustment since the 2020 geographical schedule resulted in a different level of competition for the three regions. I am assuming that the universal DH stays, so I have adjusted NL pitching before 2020 as if they faced a DH. I Ignored 2020 park factors since they’re useless. Unfortunately, I had to make best guesses for Globe Life Field (new venue), Marlins Park/Oracle (fences moved in) and Citi/Fenway/T-Mobile (humidor).
ATC Projections operate differently, in that it relies upon other projections. Unless some of the underlying models appear to operate vastly different than in the past – the methodology will remain unchanged.
Since I am relying on other sources, I won’t have to fully answer many of the questions that I posed above. However, I will have to address the question of how much emphasis to apply to the 2020 season in figuring out how to update my inter-projection weights.
Lucky for me, the inter-projection weights do not change all that much from year to year, especially for established projection sets. I intend to stress test the use of full 2020 credibility versus partial credibility – but as far as rate stats go, I imagine that I will end up using near-full credibility for the 2020 season.
Playing Time
Thus far, most of the discussion has been directed towards rate stats. However, playing time is an essential component to a fantasy baseball projection. Perhaps it is the most essential.
For many reasons, this year will be incredibly challenging for anyone to accurately project innings, at-bats, etc. We don’t have as good a feel at this time about what is going on in the development of prospects – as there were no minor leagues. As we saw with Randy Arozarena, there could be an organizational player that will come out of nowhere in 2021 that will amass a large amount of playing time.
Projections would not be complete without addressing this very topic. Therefore, I have asked each expert to weigh in on what they typically do to project playing time, and if they will change their methodology for 2021 in any way.
Question – Describe the general method that your projection system uses for playing time in terms of it being either a manual process, a formulaic approach – or do you mainly rely on other sources? What changes will you make to your playing time model due to the 2020 short season?
- Mike Podhorzer (Pod Projections) – It is a manual approach. For hitters, I first project their spot in the batting order (each slot after the leadoff hitter records 15-20 fewer plate appearances over the season) using Roster Resource as a starting point and make any subjective changes. Then I project games played based on a variety of factors, and then plate appearances per game. Those projections then spit out a plate appearance forecast. For pitchers, I project games started for starters and then innings pitched per start, which then results in an innings pitched projection. For relievers, I manually project innings pitched.
- Ray Murphy (BaseballHQ) – We have a network of analysts who assign playing time percentages for each team/position. Each analyst has a portfolio of teams they cover. Early in the offseason, we’ll be fairly liberal about over-projecting playing time, so as to (for instance) give a reasonable projection for what various candidates for the OAK 2B job might look like if they win the job, even if that means we’re projecting far too many AB for the position (i.e. they aren’t all going to win the job). Then in the months of Feb/March, those PT% projections converge to exactly 100% per position, where they stay as we continue to maintain and update those allocations all season long. As for changes – we need to see what the MLB rules are. Obviously, we need to account for the NL DH if it returns. We will also need to see how the expanded rosters carry over, as in general that causes more of a fracturing of playing time, fewer true-everyday players, etc.
- Todd Zola (Mastersball) – Hitting – project PA for each spot in the batting order for every team. Project % each player will bat in that spot – Excel does the rest. Pitching – project IP/GS and GS for starting pitchers, relief inning done manually. In all instances, historical data is used as a guide and each team has logical constraints (100% for each batting spot, etc.). For 2021: No changes to the model, but there could be adjustments based on current landscape (mostly pitching), especially as relates to innings, based on both different usage patterns and a reduced workload in 2020. Even studs could be projected for fewer innings than normal.
- Jared Cross (Steamer) – We use Fangraphs Depth Charts for playing time with some adjustments based on projected lineup spots. No changes for 2021. We expect the Depth Charts to be as good as ever.
- Rudy Gamble (Razzball) –
- Use Steamer rates for true skills.
- Playing time driven by manual + formula.
- The most formulaic is DL Time. Overlay if known injury issues.
- % of Games starts with a formula but, by the time the season starts, is almost all manual.
- PA/Game is calculated by estimated % of games in lineup and factoring in team strength
- Runs/RBI account for lineup spot and lineup strength
- For projecting playing time, I think the ‘2020 short season’ is just yet another wrench in projecting SP usage in this era. I don’t think it will actually play much of an impact in projecting # of games or IP/GS. I typically rely a lot on previous year IP/GS but likely will make more manual changes to it in 2021 (and/or incorporate 2019).
- Dan Szymborski (ZiPS) – Formulaic approach. Who actually gets a job – is more the task of a human approaching the situation next spring. I am interested in algorithms telling me how good, not how much. Generally speaking, 2020 will be weighted less when it comes to “attendance.”
- Derek Carty (THE BAT) – THE BAT uses FanGraphs Depth Charts playing time. No changes for 2021, since I don’t do my own. Whatever FanGraphs changes in their process would be reflected in THE BAT, but I doubt there will be much need to change anything.
- Jeff Erickson (RotoWire) – It is a manual process, with continual tweaking in the spring.
As far as the ATC Projections go, I will be spending extra efforts in finalizing the inter-projection weights for playing time. Unlike for rates, it is not clear to me that all of the underlying projection systems will end up anywhere near what they look like in a normal year. I might have to override my formulaic (regressed) weights for projections if systems do not appear to be ‘normal.’
As my process is data driven, I cannot estimate the changes needed until I see the data. So, stay tuned.
ATC projections had performed well in the 60-game short season of 2020. Despite the extra variance of the smaller sample size – ATC did its typical job of signaling profitable players, and limiting the number of busts. As the ATC projections aggregate from the best and the brightest, I expect it to continue to perform well in 2021 amid more uncertainty.
Conclusion
Some key takeaways from this article:
- 2020 rate projections must be discounted. Experts have indicated that an appropriate general weight applied to 2020 ranges anywhere from 27-38%. I suggest 33% as a starting point.
- The impact of discounting 2020 weights will vary based on statistic.
- Including 2020 postseason statistics is debatable. If using it, they first need to be properly context adjusted – and should receive less credibility than the regular season data [50% suggested credibility].
- No special credit or debit should be given to players who over/under-performed in 2020, except on a case by case basis.
- No special treatment should be given to rookies/prospects. There will be more variance than most years in players with little major league experience.
- ATC projections will not change its methodology. Still to be verified, the inter-projection weights for rate stats should make use of the full impact of the 2020 season. Playing time weights may be a different story.
There is no one correct way to adjust for the pandemic. I hope that this exercise and survey was both helpful and insightful for you in preparing for the 2021 fantasy season.
Ariel is the 2019 FSWA Baseball Writer of the Year. Ariel is also the winner of the 2020 FSWA Baseball Article of the Year award. He is the creator of the ATC (Average Total Cost) Projection System. Ariel was ranked by FantasyPros as the #1 fantasy baseball expert in 2019. His ATC Projections were ranked as the #1 most accurate projection system over the past three years (2019-2021). Ariel also writes for CBS Sports, SportsLine, RotoBaller, and is the host of the Beat the Shift Podcast (@Beat_Shift_Pod). Ariel is a member of the inaugural Tout Wars Draft & Hold league, a member of the inaugural Mixed LABR Auction league and plays high stakes contests in the NFBC. Ariel is the 2020 Tout Wars Head to Head League Champion. Ariel Cohen is a fellow of the Casualty Actuarial Society (CAS) and the Society of Actuaries (SOA). He is a Vice President of Risk Management for a large international insurance and reinsurance company. Follow Ariel on Twitter at @ATCNY.
This is a great article Ariel, thanks for complaining all of this information and asking good questions.
A big takeaway for me is that in a year where there were more playoff games than ever before, fewer regular season games than ever before, and a skewed regular season schedule with games only against 9 different opponents, I’m amazed there isn’t more thought being put into incorporating playoff stats. Just makes no sense at all to throw away all of that data.
And as I referenced there, I’m surprised there isn’t more consideration to adjusting the stats considering we essentially had three different “leagues” with no inter-league games between the regions.
For one example, how can you look at Shane Bieber facing the same central division opponents over and over again and not be skeptical of him continuing that dominance? Tigers, Royals, Pirates, and a White Sox team that just can’t help themselves from swinging at anything within two feet of the strike zone. That some of the other 20 teams he never faced would have identified weaknesses in his new-found approach? Especially considering in his only game against a non-Central opponent he got shellacked by the Yankees who simply stopped chasing his curveball. How many other teams have had advanced scouts salivating at exposing a flaw in an opponent that they didn’t get a chance to face in 2020? I think it’d be a mistake to over-weight the data, and to not include the playoff stats which comprise 100% of all inter-regional games played in 2020.
Again, thanks for compiling all of this. It’s not only useful to get a grasp of how 2020 will be handled, but also illuminating the approach some of these people take in general.
Thank you so much for your kind words. Good points. Yes, really interesting to see what experts are doing, which is why I wrote this article.
Skin Blues:
Exactly right! Like, exactly right. That was my first thought when I read responses. For example, Nick Anderson faced more batters in the postseason than he did during the regular season. Is he broken? I do not know, but to just think that he is the guy he was during the regular season seems absolutely asinine.
Same with Arozarena. He has always hit! But to not even think about what he did during the postseason seems absolutely crazy. That was against significantly better pitching too! Do I think that pitchers will not find holes? They probably will! That is already in his current ADP. I am seeing him go top 60, if what he has done overall is a good indicator of his future performance he would be an easy first round pick. Would anyone take him in the first round? Definitely not. But if he consider all his MLB at bats, there are very few sample sizes of hitters performing that well over that period of time (STL/TB reg/TB post) who weren’t fantasy superstars. The worst of those hitters were guys like Carlos Delgado who ended his career with a 135 wRC+. To me, that says something. And he steals bases, which makes his baseline incredibly high. I’d say his current ADP is an absolute steal. I’m considering him usually around 40.
Biebers performance against the Yankees was bad. I certainly do not agree with him being the first pitcher off the board. I do think there is a pretty significant chance, maybe 30-60% that next season would be similar scheduling however. It seems almost a certainty at this point that spring training will be delayed next year (3-6 weeks from 1/20) , and I’ve bet significant amounts of money already with friends that the season is under 120 games. I think we can make further adjustments based on what happens in the next few months. It would stand to reason that if the current lockdowns (California, Oregon, Illinois, etc) are over in the timeframe that they say they will be (21 days to 1 month) that we can approximate that will happen with other states as well. But there is no reason to believe that the season won’t be delayed. In fact, I would be shocked if it wasn’t. I am doing every single DC that runs, because I feel like there is tremendous value on pitchers like Sale and Severino who would likely be ready for opening day or shortly thereafter.