Which Pitching Staffs Benefited Most From Defense?
Rawlings announced the finalists for the Gold Glove Awards on Thursday, and some teams who collectively scored well on defensive metrics were rewarded with several nominations. Conversely, several teams who scored poorly on those metrics were either shut out or left with a single nominee.
Six Cardinals have been nominated for Gold Gloves. As a team, they compiled the third-highest defensive runs above average, and their pitching staff registered the majors’ fifth-lowest BABIP (.283). The Athletics were one of five teams to have four Gold Glove nominees, and no team finished with a higher total of defensive runs above average. Correspondingly, only two pitching staffs had a lower BABIP than their .278.
The Tigers, Pirates, Rangers, Royals and Twins combined to have two position players (Adam Frazier and Alex Gordon) nominated for Gold Gloves, and all but the Royals ranked in the bottom third in defensive runs above average. (José Berrios also received a nomination.) All five teams ranked in the bottom six in pitcher BABIP.
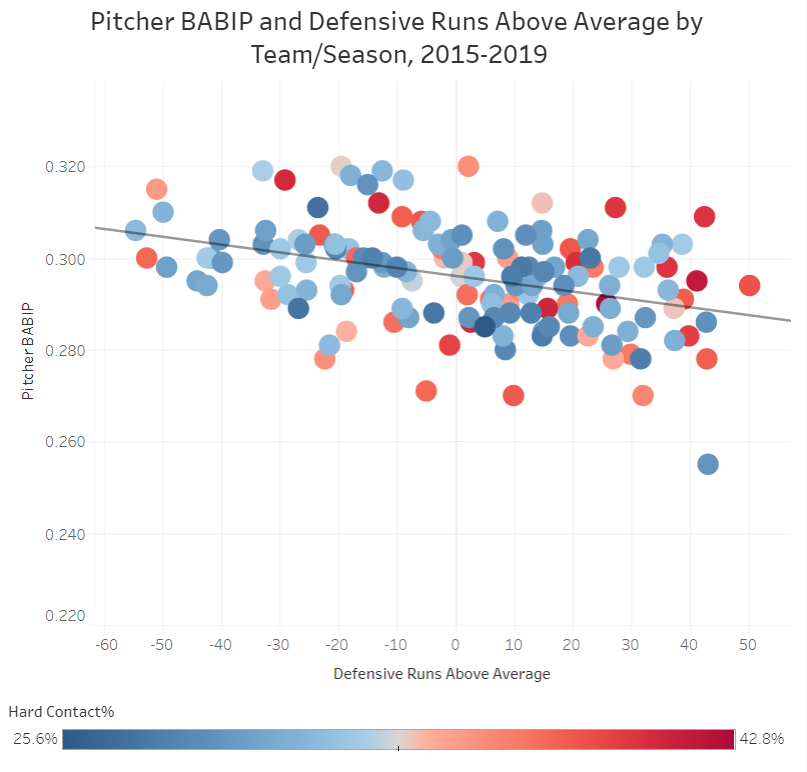
These cases hint at a relationship between a team’s defensive performance and their pitching staff’s ability to prevent hits on balls in play. This past season, teams that accrued more defensive runs above average tended to allow hits on balls in play at a lower rate, while teams with a lower defensive runs above average typically allowed higher BABIPs. However, the relationship was not as strong as it had been in previous seasons. Between 2015 and 2018, the relationship between a pitching staff’s BABIP and the team’s defensive runs above average over a season produced an R-squared of 0.16, which was statistically significant at the p < .0001 level. In 2019, the R-squared was just 0.12, and the level of statistical significance fell just short of the 0.05 level.
The relationship for the entire pool of team seasons since 2015 is shown in the graph below. I tried to account for some of the variation by color-coding for a pitching staff’s hard contact rate, and it may explain a few outliers. The Royals’ staff has posted higher-than-average BABIP rates of .309 and .311 in each of the last two seasons, even though the team has been one of the better defensive clubs over the last two years (Gold Glove snubs notwithstanding). The staffs from those seasons have been among the biggest BABIP underachievers, as indicated by the two dark red dots in the upper-right portion of the graph. In both seasons, the Royals’ pitchers have not helped themselves, as they have been vulnerable to hard contact. The 2016 Cubs, as represented by the blue dot in the lower-right corner, had a terrific defense, but their pitchers were also good at avoiding hard-hit balls.
There are two impacts from these trends that are worth paying attention to. One is that, with the relationship between defense and pitcher BABIP weakening in 2019, we have to consider the possibility that the rocket ball made defensive performance slightly less relevant to pitcher success. The research that I conducted with Alex Chamberlain last offseason established that BABIP had a statistically significant correlation with the rate of balls hit with an exit velocity of at least 95 mph and with average exit velocity on ground balls (EV GB). If an increasing share of batted balls are being hit with greater exit velocity, that could chip away at any advantage pitchers may have when relying on their ability to induce soft contact.
Without knowing what type(s) of baseballs MLB will use next season, we can consider that, once again, defense may matter less in 2020, but it will still play a role — maybe an important one — in how successful pitchers will be on balls in play. Therefore, the second takeaway we get from the relationship depicted in the graph is that we should still consider a team’s defense when evaluating pitchers for drafts in 2020. For example, if the Cardinals keep their strong defense intact, we may not see much regression from Jack Flaherty (.242 BABIP). Then again, given how many bats he misses, we shouldn’t worry much about his BABIP one way or the other. As a pitch-to-contact type, another low BABIP will be critical for Dakota Hudson (.274 BABIP), if he is to come anywhere close to this season’s 3.35 ERA and 16 wins.
The Athletics’ starters could be especially stingy with hits on balls in play next season. Not only do they have several good defenders primed to return in 2020, but they play in a park that is typically one of the toughest for getting hits on balls in play. Sean Manaea (.194 BABIP in five starts) and Mike Fiers (.254 BABIP) should be able to help with ERA and WHIP. At the very least, Frankie Montas won’t likely revert to being the .335 BABIP pitcher he was prior to this season.
The Diamondbacks, who were second to the Athletics in defensive runs above average, had a normal .295 staff BABIP, but aside from Zack Greinke (.263 BABIP) and Taylor Clarke (.260 BABIP), all of their starters had hard contact rates above 40 percent. Robbie Ray (43.4 percent), Luke Weaver (43.7 percent) and Mike Leake (45.9 percent) were especially prone to allowing hard contact, yet their BABIPs were all in the .290-to-.305 range. The Diamondbacks, as currently constituted, have a logjam of starting pitchers, so if any are traded this offseason, they could lose value just by virtue of going to a team with a lesser defense.
Fantasy owners are likely to apply discounts to pitchers on the Pirates, Tigers, Orioles and Mariners, solely because they will have a harder time getting wins. These teams were the four worst squads defensively in 2019, so barring any offseason upgrades, their pitchers could also suffer a second penalty for being at risk of a high BABIP. If Matthew Boyd gets traded this offseason and owners don’t adjust for his change of scenery, he could be a tremendous bargain. A 3.61 SIERA suggests that Boyd deserved much better than a 4.56 ERA, and with a better defense behind him, he could shave some points off a .307 BABIP.
Two of the biggest BABIP outliers over the last five seasons were this year’s Astros and Dodgers. Despite having middling defenses and hard contact rates, those staffs posted BABIPs of .270 and .271, respectively. In the case of the Astros, the innings put in by Justin Verlander (.218 BABIP) and Gerrit Cole (.275 BABIP) went a long way towards deflating the BABIP for the whole staff. Verlander’s propensity for inducing popups and Cole’s aversion to hard contact (33.9 percent rate) helped both pitchers to avoid hits on balls in play. Those skills, in tandem with high strikeout rates, enabled both pitchers to register an xBA below .190. The Dodgers’ low BABIP may have been more of a fluke. Clayton Kershaw (.262 BABIP) and Hyun-Jin Ryu (.278 BABIP) each did their part to lower the team mark, but the batting averages they allowed were 18 and 22 points below their xBAs, respectively. Both pitchers may get discounted due to health concerns, but with the threat of BABIP regression, owners have another risk to consider with them.
Al Melchior has been writing about Fantasy baseball and sim games since 2000, and his work has appeared at CBSSports.com, BaseballHQ, Ron Shandler's Baseball Forecaster and FanRagSports. He has also participated in Tout Wars' mixed auction league since 2013. You can follow Al on Twitter @almelchiorbb and find more of his work at almelchior.com.
Just look at the Fielding%