Using Flyball Launch Angle to Spot Risers and Fallers
In the aftermath of last Thursday’s trade that sent J.T. Realmuto from the Marlins to the Phillies, I’m started to look into how much of a hit Jorge Alfaro’s fantasy value would take going from Citizens Bank Park to Marlins Park.
The exercise turned out to be a convoluted mess. Ultimately, it led to a finding that could prove useful in identifying players who are due for spikes or dips in their power numbers.
With the dramatic change in park factors, I started out by trying to find a similar hitter from the Marlins in 2018 to find a comp for Alfaro’s new projection. I needed to identify hitters with signs of raw power, since Alfaro ranked in the top 20 percent in hard-hit rate (percentage of batted balls hit with an exit velocity of at least 95 mph). He was also just outside the top 20 percent in exit velocity on flyballs and line drives, (min. 150 batted balls) and just missing the top 10 percent in average flyball distance (min. 25 flyballs).
In stacking Alfaro up against the 2018 Marlins, two hitters stood out: Justin Bour and Brian Anderson. All three were in the same neighborhood in terms of exit velocity on flies and liners (EV FB/LD), and Anderson had a similar hard-hit rate. (I did not have Bour’s hard-hit rate for the portion of the season he spent with the Marlins.) However, while Bour’s average flyball distance was merely one foot short of Alfaro’s, Anderson’s was a whopping 31 feet lower.
| Player | 95 MPH+ % | EV FB/LD | Avg. FB Distance. (feet) |
|---|---|---|---|
| Jorge Alfaro | 44.0% | 94.5 | 337 |
| Justin Bour | N/A | 95.5 | 336 |
| J.T. Realmuto | 40.8% | 92.4 | 322 |
| J.T. Riddle | 29.0% | 90.8 | 320 |
| Lewis Brinson | 38.6% | 93.7 | 315 |
| Starlin Castro | 36.2% | 91.9 | 315 |
| Derek Dietrich | 37.7% | 90.8 | 311 |
| Brian Anderson | 42.3% | 93.0 | 306 |
This made no sense to me, so I put aside the Alfaro projection to figure out what was going on here. Both EV FB/LD and average flyball distance have a strong positive correlation with ISO and HR/FB, so it seemed unlikely to me that they could be so loosely related to each other. The first idea I had was that maybe Anderson was hitting too many of his flies a little too high, robbing the ball’s path of some horizontal distance.
I regressed average flyball distance against EV FB/LD for all hitters who had at least 50 flyballs in 2018. In putting the results in a scatterplot and color coding each player according to their average launch angle on flyballs, I learned two things. First, average flyball distance and EV FB/LD do have a strong positive correlation. It also appears that the hitters who have a much greater average flyball distance than would be predicted by the regression were the least prone to hit ultra-high flies. Take a look at how much more distance Christian Yelich and Maikel Franco got on flies last year as compared to what the regression equation would predict. Then notice how much lower their average flyball launch angle was than everyone else included on the graph.
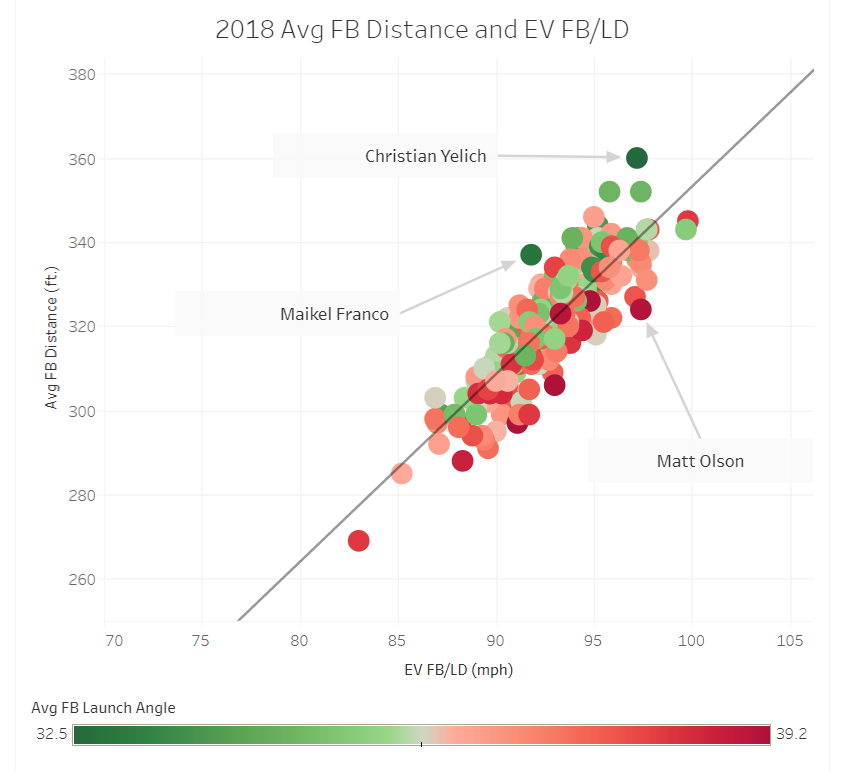
Similarly, there were several players at the high end of the flyball launch angle continuum, like Matt Olson, who appeared to get cheated on their flyball distances. The table below shows all of the hitters whose actual average flyball distance was at least 15 points above or below their estimated average distance. The average flyball launch angle for hitters with at least 50 flyballs in 2018 was 36.4 degrees, but every one of the five distance underachievers had a higher-than-average launch angle, and four of them clocked above 38 percent. Meanwhile, the three distance overachievers were all under 35 percent, with Yelich and Franco finishing below 33 percent.
| Hitter | EV FB/LD | FB Launch Angle | Avg FB Distance | Est FB Distance | Difference |
|---|---|---|---|---|---|
| Matt Olson | 97.4 | 39.1 | 324 | 342 | -18 |
| Adam Engel | 91.7 | 38.2 | 299 | 316 | -17 |
| Kolten Wong | 91.1 | 39.2 | 297 | 313 | -16 |
| Brian Anderson | 93 | 39.2 | 306 | 322 | -16 |
| Logan Forsythe | 89.6 | 37.3 | 291 | 307 | -16 |
| Ian Desmond | 95.8 | 34.6 | 352 | 334 | 18 |
| Christian Yelich | 97.2 | 32.5 | 360 | 341 | 19 |
| Maikel Franco | 91.8 | 32.8 | 337 | 317 | 20 |
This alone doesn’t tell us what to expect from these hitters in 2019. Should we expect Olson and Anderson to hit for less power than their exit velocities would indicate? Will Yelich pummel low flies on his way to another MVP season?
Data from the last four seasons indicate otherwise. Players who are at the extremes of the flyball launch angle spectrum tend to regress by approximately two percentage points the following season. (Note: If you want to test this out, the regression equation is Year 2 FB LA = 25.98+ (0.29 * Year 1 FB LA). The Pearson’s r for this relationship is 0.287, which has a p-value below .0001.) That means we can probably look forward to Yelich hitting more high flies and fewer extra-base hits and Olson hitting more low flies and more extra-base hits.
Before we get too carried away with those assumptions, let’s check in on the 2017 hitters whose average flyball distances were the furthest from their estimated average distances and see if they corrected themselves in 2018. The five hitters in the table below were the biggest flyball distance underachievers among those who had average flyball launch angles of at least 37 degrees in 2017 and hit at least 50 flyballs in both 2017 and 2018.
Everyone in this underachiever group increased his average flyball distance last season, and Max Kepler, Dansby Swanson and Avisail Garcia increased their distances by more than 10 feet. For all three of those hitters, you can see that their 2018 average flyball distance tracks more closely with their 2017 estimated average than with their 2017 actual average. The only player in this group whose average flyball launch angle did not regress back towards the major league mean was Kepler.
| Hitter | 2017 Avg FB Distance (ft.) | 2017 Est FB Distance (ft.) | 2018 Avg FB Distance (ft.) | 2017 FB Launch Angle (degrees) | 2018 FB Launch Angle (degrees) | 2017 ISO | 2018 ISO |
|---|---|---|---|---|---|---|---|
| Lorenzo Cain | 303 | 320 | 309 | 37.7 | 35.4 | 0.140 | 0.109 |
| Max Kepler | 305 | 320 | 316 | 37.6 | 38.3 | 0.182 | 0.184 |
| Enrique Hernandez | 309 | 324 | 312 | 38.6 | 37.1 | 0.205 | 0.214 |
| Dansby Swanson | 302 | 317 | 321 | 38.3 | 35.8 | 0.092 | 0.157 |
| Avisail Garcia | 319 | 334 | 334 | 38.0 | 36.7 | 0.176 | 0.202 |
For us fantasy owners, greater flyball distances don’t mean much if they don’t translate into an increased rate of extra bases. Cain’s ISO actually dropped by 31 points, but that can be tied to a more than 10 percentage point gain (from 44.4 percent to 54.6 percent) in ground ball rate. Kepler’s and Hernandez’s gains in ISO were modest, though Hernandez did increase his HR/FB ratio from 12.6 percent to 14.6 percent.
That leaves Kepler as the only hitter in this group who maintained or decreased his ground ball rate and did not experience some type of notable increase in power production. Recall, though, that he was also the only one who did not have the expected regression in flyball launch angle. As Ben Kaspick pointed out in a recent column, Kepler looks like a sneaky value pick in upcoming drafts. He appears due for more low flies and extra-base hits.
We see a similar pattern of regression in flyball distance and flyball launch angle with the top flyball distance overachievers (average 2017 flyball launch angle below 36 degrees, min. 50 flyballs in 2017 and 2018). Of these six players, five hit flyballs for shorter distances on average in 2018, and four decreased their average distance by at least 12 feet.
| Hitter | 2017 Avg FB Distance (ft.) | 2017 Est FB Distance (ft.) | 2018 Avg FB Distance (ft.) | 2017 FB Launch Angle (degrees) | 2018 FB Launch Angle (degrees) | 2017 ISO | 2018 ISO |
|---|---|---|---|---|---|---|---|
| Charlie Blackmon | 338 | 318 | 325 | 35.7 | 36.7 | 0.270 | 0.211 |
| Carlos Gonzalez | 341 | 323 | 323 | 34.4 | 34.9 | 0.162 | 0.190 |
| J.D. Martinez | 356 | 342 | 341 | 34.6 | 34.5 | 0.387 | 0.299 |
| Stephen Piscotty | 331 | 317 | 325 | 35.4 | 37.5 | 0.132 | 0.223 |
| Tommy Pham | 343 | 331 | 344 | 35.9 | 33.8 | 0.214 | 0.188 |
| Jay Bruce | 333 | 321 | 321 | 35.2 | 37.3 | 0.254 | 0.147 |
Four of these hitters also had substantial decreases in their ISOs from 2017 to 2018. Carlos Gonzalez, whose ISO increased by 28 points, was an exception, but according to xStats, his expected home run total was just 11.3, as compared to his actual total of 16. Stephen Piscotty went even farther against the grain, increasing his ISO from .132 to .223, even though he hit flies six feet shorter on average. This is a tough one to figure out, but Piscotty appeared to have padded his home run total by hitting more flies at the parks of the Athletics’ divisional rivals. Every one of those venues rated as above average for home run park factor for right-handed hitters in 2018, and Piscotty posted a 38.7 percent ground ball rate and a 19.4 percent HR/FB ratio across those parks. At home, he had a 46.8 percent ground ball rate and a 15.4 percent HR/FB ratio.
Pham’s ISO corrected itself, even though his average flyball distance actually went up by a foot. However, he looks to be due for an additional decline in 2019. He outperformed his estimated average flyball distance by 12 feet in 2018, just as he did in 2017. Not only did Pham’s average flyball launch angle not regress last season, it got even lower.
Looking back at 2017’s flyball distance over- and underachievers, players like Cain and Piscotty are the outliers. Most of the hitters who had average flyball distances that were out of synch with their average exit velocity on flyballs and line drives saw their ISOs adjust in 2018. That bodes well for players like Olson, Anderson and Engel to receive a power boost this season, and less well for Yelich, Desmond and Franco to match their power output from a season ago. The fantasy implications for Yelich are clear, as he may hit nine or 10 fewer homers than he did last year. That puts him just outside my top 15, rather than as a top eight player overall, as he is being treated in early drafts.
Al Melchior has been writing about Fantasy baseball and sim games since 2000, and his work has appeared at CBSSports.com, BaseballHQ, Ron Shandler's Baseball Forecaster and FanRagSports. He has also participated in Tout Wars' mixed auction league since 2013. You can follow Al on Twitter @almelchiorbb and find more of his work at almelchior.com.
Did you ever get back to the Alfaro analysis and come to a conclusion?
Yes! There wasn’t really a good comp on the 2018 Marlins, because Alfaro has exteme oppo% and K%. The closest comp I could find anywhere was Cory Spangenberg: high K%, high oppo%, high BABIP, pitcher-friendly park. Figuring Alfaro will get approx. 500 PA, I expect he will bat .235 with 11 homers (I previously had him projected for 13).
Crazy to think that Matt Olson actually underperformed on HR/FB when he still had a respectable 16.1%! If he plays 162 games again would you predict 35-40 HRs for him this season based on this data?
There is really not much that separates Olson from Khris Davis. I think Olson could easily exceed 40 HR, though to be conservative, I’d project him for the high 30s.
I agree with you on the Olson. I watched probably every one of his at bats last year, and to me it felt like he got screwed ala Judge on strikes a lot as well. He is also very tall, and stands up straight, and he got a lot of balls called strikes. With that said, he seemed to just miss a lot of home runs. He is going to have a 50hr season in him one day.
On the Alfaro, I like it simply because he will likely hit in the middle of the order, and will probably be in the top 5 at bats for catchers. That is enough that I don’t really care about the park change. A league average bat in a catcher who shouldn’t get squeezed at all for playing time is a good thing.
I have a hard time abiding a player with a 35% K rate, and even if it comes down to the 31.7% that Steamer projects, that’s going to lead to a lot of big time slumps and low counting stat numbers. Not that there are a great selection of catchers to choose from, but I’d rather spend an extra $2 on Cervelli than settle for Alfaro in Miami.
very cool.
I know Pham hit more flyballs late (26.4% FB% with STL and 32.4% with TB and also increased his liners from 21.3% to 30.4% now that I take a look), although I’m not sure about his launch angle them or if that’s even something accessible. Do you think that the increase in FB rate could potentially help him fend off some of the regression that is indicated in these numbers/this article?
That’s an interesting point about Pham’s numbers with TB. His whole batted ball profile changed. In addition to dramatically lowering his ground ball rate, he became very averse to pulling. The sample is pretty small, so I’m not assuming those trends will continue. Even if I did, a decreased pull rate would neutralize at least some of the impact of an increased flyball rate.
You can do a custom date query for launch angle on Baseball Savant, so I will give this a closer look.
There is a very important backspin component on distance that is absolutely critical when considering distance and performance. The best hitters hit the ball flat with less backspin so distance is shorter for the same EV and LA. For example, Mookie Betts increased both EV and LA last year but his distance decreased 13 ft. from 2017. It turns out, he had the biggest reduction in backspin of all regular players. Article here if interested https://community.fangraphs.com/why-alex-bregman-will-out-regress-mookie-betts/
D.K., thanks for the comment and the link. Really wished I had read this before I wrote this piece. I’d be curious to see the year-to-year relationship on backspin. I suspect it’s similar to that of flyball launch angle.
Thanks. It is typically stable year to year unless players make big mechanical changes like Mookie did last year. Votto is near the top of the list on negative distance from spin every year. The model is essentially relative drag measured in feet so it’s also useful in looking at what is going on with the ball – such as the large increase in drag last year.
Forgive my ignorance on the subject but I’ve always wondered how useful of a stat average launch angle is. For example, if player A hits 50 balls at a launch angle of 30 degrees and 50 balls at 40 degrees, he’ll end up with an average launch angle of 35 degrees. If player B hits 100 balls at a launch angle of 35 degrees, he’ll end up with an average launch angle of 35 degrees as well. Both players should have dramatically different outcomes but their average launch angle is identical. Wouldn’t it be better to determine the optimal launch angle and have a stat based on how much it varies from that number? Or maybe that already exists. Or maybe I don’t know what I’m talking about.
Batted ball launch angle for each player follows a normal distribution. What you described with Player A is an example of bimodal/multimodal distribution that just doesn’t happen in reality.
As for optimal launch angle, yes, studies have been done. But there is lots to take into account. First, your exit velocity matters a lot (the harder you hit it, the higher you should want to hit it).
There’s a difference between ideal launch angle on an individual batted ball, and ideal average launch angle over the course of a season. If based on a guy’s EV, his ideal LA (with highest xwOBA) for a single batted ball was 29*, that doesn’t mean that his ideal average LA should be 29*. Because around half of his batted balls will be above the average, and the other half below. You can’t get much higher than 29* without hitting popups that are guaranteed outs, so a huge portion of his batted balls are now easy fly balls. An analogy is that the shortest distance around Rainbow Road in Mario Kart involves spending 90% of your time right on the edge of a cliff. But if you screw up even a tiny bit, you fall off the edge. So you want to be sufficiently away from the edge such that a certain amount of standard deviations of how good your steering is will not let you fall off.
So, most people want to skew lower with LA, so that their average LA is a line drive (maybe 14*), with half of their hits high line drives and fly balls, and the other half being low line drives and some grounders. They want to minimize easy popups and worm burners smashed into the ground in front of home plate. This is illustrated really well in this article from Jeff Zimmerman: https://fantasy.fangraphs.com/finding-a-simple-ideal-launch-angle/
Yes, exactly – you have to consider distributions for both LA and EV, then look at outcome values for each combination. I did this based on expected run values (have a chart that I could dig up if interested). Also, the distributions had slight skew to consider as well. In the end, the results showed that players with higher EVs should have higher target LAs which is really no surprise. However, there is also a cost side of the equation to consider – Ks go up with both LA and EV.
https://imgur.com/dfdhGuD