The Sexiest of All Topics: Plate Appearances
In 2022 the average number of plate appearances among big leaguers was 121. A plate appearance marks any time a player walks up and digs into the batter box. Each spit, every toe twist, and all of the glove-tightening times in the box accumulate together into plate appearances. Let’s start with the easy one. Who had the most? Marcus Semien. He had 724. In fact, he had exactly 724 last season as well. That’s roughly 4.5 plate appearances per game.
That’s absurd.
He played in 161 games in 2022 and he wasn’t even the player who played in the most games this year. That would be 162 games and, actually, two players did it; Dansby Swanson and Matt Olson. Teammates! The Ironman Cal Ripken, Jr. averaged 4.3 plate appearances (12,883) per game (3,001) for his career. What Semien, Swanson, and Olson did this year is special. It should be an award in itself. If it is already and I don’t know it, don’t blast me. But I’m pretty sure people would just say, “Oh, an award just for showing up?” and I would argue that showing up is rare these days.
Here’s a histogram of 2022’s every plate appearance:

The median number of plate appearances among all ball players in 2022 was 220. On the tail ends are the fellas I mentioned above and the real Moonlight Graham types, those who appeared in one game and did not record a plate appearance. The lucky two players of 2022 to earn Moonlight status were Cory Spangenberg and Scott Kingery. Spangenberg spent his year in AAA but was called up for the St. Louis trip to Canada. He relieved Brendan Donovan at third, who relieved Albert Pujols at first, and did not get to dig into the box. In much the same way, Kingery came into the game as a defensive substitute for starting second baseman Bryson Stott, who moved to shortstop to give starter Didi Gregorius some time off his feet. Didi would end up getting the rest of the season off his feet the day after his one-for-four day on August third as he was released by the club on the fourth.
In the middle of the above histogram were your, well, average players and the average number of plate appearances in 2022 was 264 rounding up. No player accumulated exactly the average number of plate appearances, but there were three players who were exactly in the middle (median) with 220 plate appearances:
| Name | Team | G | PA | HR | R | RBI | SB | AVG | WAR |
|---|---|---|---|---|---|---|---|---|---|
| Ezequiel Duran | TEX | 58 | 220 | 5 | 25 | 25 | 4 | 0.236 | 0.1 |
| Jonathan Villar | – – – | 59 | 220 | 3 | 25 | 18 | 7 | 0.208 | -1.3 |
| Robinson Chirinos | BAL | 67 | 220 | 4 | 10 | 22 | 1 | 0.179 | -1.6 |
Hopefully, you didn’t have a tremendous amount of shares on any of these players and if you did, you didn’t hang on. Plate appearances are valuable and if you drafted players who accumulated a lot of them you in turn accumulated value:
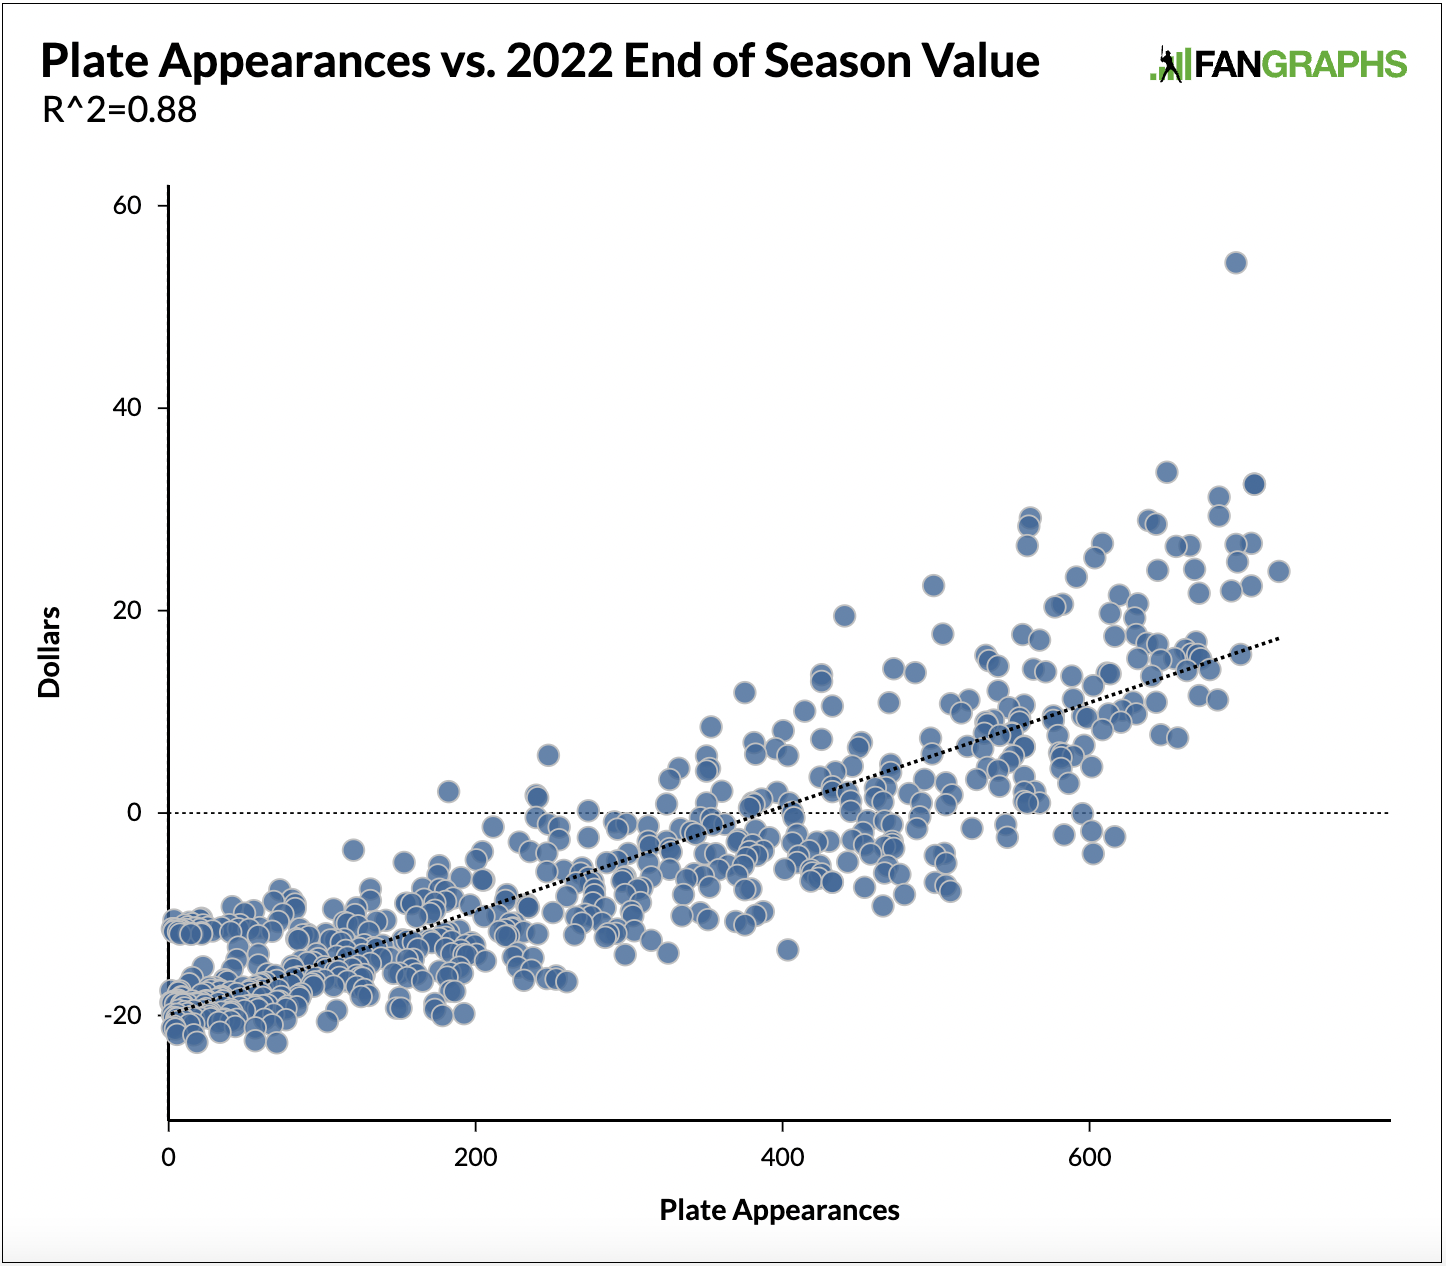
One of the biggest outliers on the year was Aaron Judge with all that value, all those plate appearances, and each one of those dingers. But, he was actually projected by Steamer pre-season for 665 plate appearances. He accumulated 696, but who would ever project that? Who else exceeded their plate appearance expectations? Here are the top 10:
| Name | Steamer Preseason PA Projection | Actual 2022 PA | Diff | Dollars |
|---|---|---|---|---|
| Brandon Drury | 38 | 568 | 530 | $17.09 |
| Brendan Donovan | 20 | 468 | 448 | $2.51 |
| Luis Rengifo | 103 | 511 | 408 | $1.79 |
| Geraldo Perdomo | 123 | 500 | 377 | -$6.86 |
| William Contreras | 30 | 376 | 346 | $11.90 |
| MJ Melendez | 199 | 534 | 335 | $8.77 |
| Willi Castro | 66 | 392 | 326 | -$2.44 |
| Gilberto Celestino | 26 | 347 | 321 | -$9.85 |
| Nick Gordon | 123 | 443 | 320 | $2.05 |
| Thairo Estrada | 227 | 541 | 314 | $12.07 |
Plate Appearances aren’t everything, but they help a lot. For example, Celestino filled in for injured Twins a lot in 2022 as a 23-year-old. In last season’s Top 39 Prospects for the Minnesota Twins written by Eric Longenhagen, Celestino ranked 10th in the organization. Earning 122 games in 2022 after 23 in 2021 means something. What exactly? I don’t know since he returned such negative value, but I’m sure it means something.
Looking at the flip side of this analysis, who didn’t meet expectations, isn’t as informative because it so often is a result of injury, but here it is anyway:
| Name | Steamer Preseason PA Projection | Actual 2022 PA | Diff | Dollars |
|---|---|---|---|---|
| Miguel Sanó | 619 | 71 | -548 | -$22.70 |
| Kris Bryant | 669 | 181 | -488 | -$8.73 |
| Adalberto Mondesi | 536 | 54 | -482 | -$18.98 |
| Willie Calhoun | 494 | 62 | -432 | -$18.22 |
| David Fletcher | 655 | 228 | -427 | -$13.83 |
| Bobby Bradley | 439 | 17 | -422 | -$21.91 |
| Ozzie Albies | 673 | 269 | -404 | -$5.94 |
| Anthony Rendon | 590 | 193 | -397 | -$13.98 |
| Lorenzo Cain | 546 | 156 | -390 | -$16.25 |
| Mitch Haniger | 629 | 247 | -382 | -$5.80 |
Now, a deep dive is fun, it’s interesting, it’s hip, it’s “with it”. But what we’re really after is trying to figure out who to put our money on for next year. Who is likely to repeat? Ask any projection system maintainer and they’ll tell you it’s impossible. I won’t be trying to project next season’s plate appearances. But, what I will do is look at the players who have accumulated a lot year after year. Here are the players who have accumulated the most plate appearances in the past four years:
| Name | 19PA | 20PA | 21PA | PA | 4 Year Total |
|---|---|---|---|---|---|
| Marcus Semien | 747 | 236 | 724 | 724 | 2431 |
| Freddie Freeman | 692 | 262 | 695 | 708 | 2357 |
| Jose Abreu | 693 | 262 | 659 | 679 | 2293 |
| Whit Merrifield | 735 | 265 | 720 | 550 | 2270 |
| Pete Alonso | 693 | 239 | 637 | 685 | 2254 |
| Paul Goldschmidt | 682 | 231 | 679 | 651 | 2243 |
| Rafael Devers | 702 | 248 | 664 | 614 | 2228 |
| Manny Machado | 661 | 254 | 640 | 644 | 2199 |
| Cesar Hernandez | 667 | 261 | 637 | 617 | 2182 |
| Trea Turner | 569 | 259 | 646 | 708 | 2182 |
These are all players who we should be able to count on at this point. It’s likely each one of them has played through injury to accumulate such a high PA count, but it means that they have consistently shown up the past four seasons. There were also plenty of players who didn’t appear as often, but still accumulated value. By performing a cluster analysis on plate appearances and end of season value, we end up with essentially the same scatter plot from above, but broken down into distinct groups:
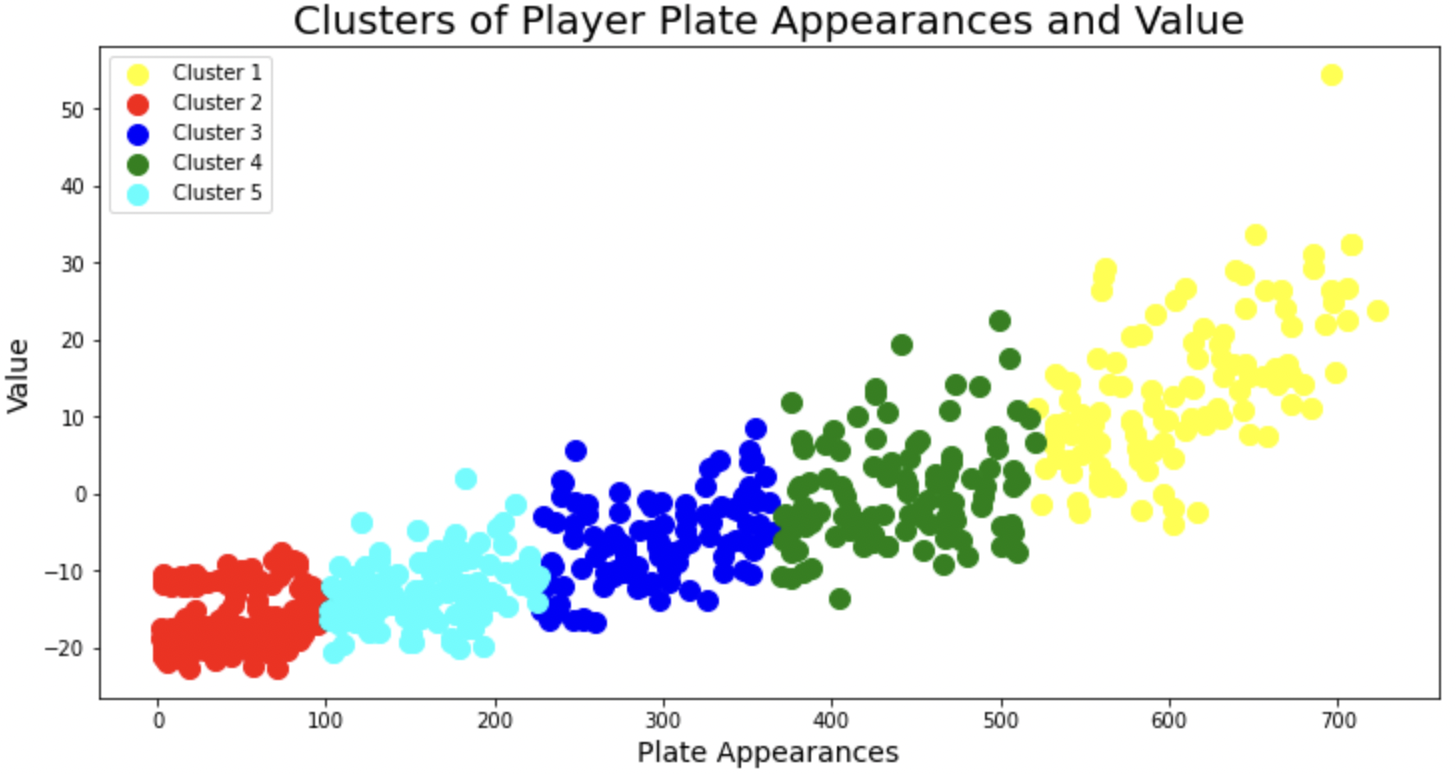
The upper portion of the green and blue clusters are interesting because they either were valuable and injured, or they were valuable and didn’t get the opportunity they deserved. Most interesting from this perspective are the upper portions of the green and blue clusters as they returned positive value while collecting closer to average times at the plate. Here’s all the players in cluster three (blue) who earned positive value and how many days they spent on the IL in 2022:
| Name | PA | Dollars | IL Days |
|---|---|---|---|
| Jake McCarthy | 354 | $8.51 | |
| Danny Jansen | 248 | $5.71 | 69 |
| Eric Haase | 351 | $5.64 | |
| Christian Bethancourt 베탄코트 | 333 | $4.42 | |
| Jose Trevino | 353 | $4.40 | |
| Albert Pujols | 351 | $4.14 | |
| Eloy Jiménez | 327 | $3.31 | 73 |
| Oneil Cruz | 361 | $2.15 | |
| Nick Fortes | 240 | $1.76 | |
| Jazz Chisholm Jr. | 241 | $1.52 | 99 |
| Tim Anderson | 351 | $1.00 | 81 |
| Austin Slater | 325 | $0.90 | 27 |
| Jorge Alfaro | 274 | $0.22 | 11 |
Those not highlighted in red could have the potential for more opportunities in 2023. Those not highlighted are very likely to collect more plate appearances in 2023 as longs as they can return to health. Here’s the same table showing those in cluster four (green):
| Name | PA | Dollars | ILDays |
|---|---|---|---|
| Mike Trout | 499 | $22.47 | 35 |
| Michael Harris II | 441 | $19.47 | |
| Starling Marte | 505 | $17.69 | 29 |
| Salvador Perez | 473 | $14.26 | 47 |
| Willson Contreras | 487 | $13.87 | 24 |
| Travis d’Arnaud | 426 | $13.67 | |
| Bryce Harper | 426 | $13.00 | 61 |
| William Contreras | 376 | $11.90 | |
| Adley Rutschman | 470 | $10.90 | |
| Josh Rojas | 510 | $10.80 | 32 |
| Joc Pederson | 433 | $10.57 | 8 |
| Cal Raleigh | 415 | $10.07 | |
| Nico Hoerner | 517 | $9.90 | 13 |
| Luis Robert | 401 | $8.13 | 33 |
| Kolten Wong | 497 | $7.40 | 20 |
| Christian Vazquez | 426 | $7.28 | |
| Giancarlo Stanton | 452 | $6.97 | 42 |
| Byron Buxton | 382 | $6.96 | 44 |
| Andrew Benintendi | 521 | $6.59 | 33 |
| Jonah Heim | 450 | $6.47 | |
| Trevor Story | 396 | $6.36 | 62 |
| Josh Naylor | 498 | $5.84 | 18 |
| Tyler O’Neill | 383 | $5.82 | 63 |
| Jon Berti | 404 | $5.67 | 48 |
| Gary Sanchez | 471 | $4.81 | |
| Seiya Suzuki | 446 | $4.63 | 38 |
| Harold Ramirez | 435 | $4.06 | |
| Gavin Lux | 471 | $4.01 | |
| Christopher Morel | 425 | $3.56 | |
| Lourdes Gurriel Jr. | 493 | $3.32 | 28 |
| Marcell Ozuna | 507 | $2.99 | |
| Keibert Ruiz | 433 | $2.61 | 27 |
| Brendan Donovan | 468 | $2.51 | |
| Brandon Marsh | 461 | $2.48 | 10 |
| Raimel Tapia | 433 | $2.12 | |
| Austin Nola | 397 | $2.05 | |
| Nick Gordon | 443 | $2.05 | |
| Jose Miranda | 483 | $1.93 | |
| Luis Rengifo | 511 | $1.79 | |
| Daniel Vogelbach | 461 | $1.54 | 10 |
| Jean Segura | 387 | $1.38 | 64 |
| Jorge Polanco | 445 | $1.17 | 51 |
| Bryson Stott | 466 | $1.08 | |
| Tyrone Taylor | 405 | $1.00 | 20 |
| Santiago Espinal | 491 | $1.00 | 14 |
| Elias Diaz | 381 | $1.00 | |
| Oscar Gonzalez | 382 | $0.86 | 33 |
| Nelson Cruz | 507 | $0.82 | |
| Martin Maldonado | 379 | $0.52 | |
| Ramón Urías | 445 | $0.18 | 42 |
| Chas McCormick | 407 | $0.08 |
You can see that this list is heavy on catchers because they ultimately end up with fewer plate appearances than say an outfielder, but with higher value given their positional scarcity. Take it for what it’s worth. But, there are a number of interesting players who received middle of the pack opportunities and still finished with value.
At this point I think I have worn out my welcome and if you see another table you may click somewhere else. However, a plate appearance deep dive takes time and can be boring. But, it’s necessary to analyze as part of next season’s draft preparation. Just remember that plate appearances earn value. As the late, great Stephen Hawking once said, “Half the battle is just showing up.” In fantasy baseball, it’s probably more like 88%.
I appreciated and enjoyed this article. You haven’t worn out this reader’s welcome, Lucas. Full time at bats by players that are not in a platoon and injury prone are incredibly valuable, particularly in weekly leagues with shallow benches. You have attempted to quantify this, which I find so valuable. In my humble opinion, I tend to rely on depth charts with the staff inputs from fangraphs as being more valid than those projected by steamer, although I have never done anything to support my possibly invalid instincts.