The Many Ways to Build an Ottoneu Contender
One of the most common questions I get in the off-season is around how many players a team should keep. Do you want to keep as many as possible, limiting your dependence on the draft and its fickle nature? Do you want to keep only the very best keepers, and take advantage of the values that creep up at a draft? Does it not matter, because everything that matters happens in-season?
The answer I almost always give is that it depends. You should keep as many players as you have that are worth keeping. You should depend on the draft as much as you need to. You should work in-season moves, as well. How you balance those things, I have argued, should be based on a combination of your team, your league, and your preferences. But I never had any data to back that up. Now I do.
In Ottoneu Slack, Kenny Wilson shared some pie-charts he made of how points were acquired for his teams.
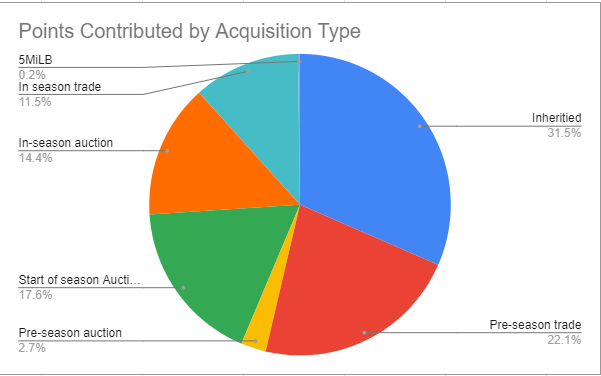
For each of his teams in a points league, he was looking at where his points came from. This team, which was a team he picked up in the off-season, hence the term inherited, got most of it’s points from players already on the roster or players he picked up via trade before the season.
His charts created a bit of a stir and got others – me included – thinking about how this data could be used more broadly. Lucky for me, Adam Scharf, who joined me on an episode of Keep or Kut almost a year ago, again stepped up to lend his data capabilities to the cause.
Adam pulled similar data from the champions of 136 non-first-year FanGraphs Points leagues that were eligible for the Ottoneu Prestige League. Why league champs? We know that there are lots of strategies out there, but the question we wanted to look at was whether one strategy was particularly dominant. Why non-first year leagues? Because how keepers impact champs is a big part of the question. Why points leagues? Because it is easier to quantify where production came from when production is being boiled down to a single number. And why OPL-eligible leagues? Because this ensures that we are not seeing any unexpected impacts of teams that have atypical economics.
So, what did Adam find? Let’s start with these two pie charts:
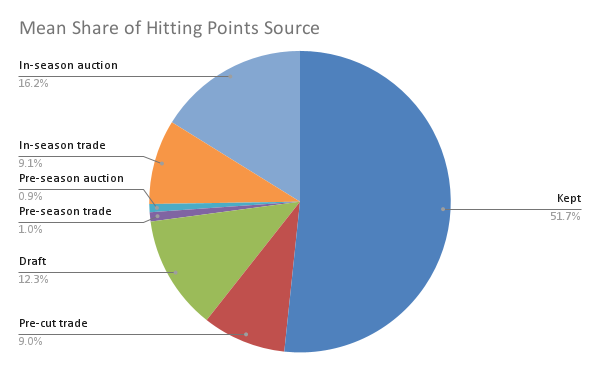
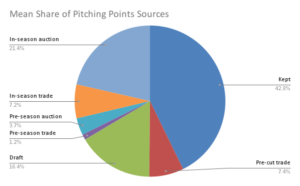
These pie charts show what share of points, on average, champions got from different sources. The way to read this is that, on average, league champions got 51.7% of their hitting points and 42.8% of their pitching points from players they kept from the previous season. For both hitters and pitchers, the next biggest source of points was in-season auctions – guys picked up via 48 hour auctions started in-season to acquire free agents. The other sources on here are:
- Pre-cut trade: players acquired via trade in the off-season between arbitration and the cut deadline
- Draft: players acquired in the pre-season auction
- Pre-season trade: players acquired via trade after the draft but before Opening Day
- Pre-season auction: players acquired via 48-hour auctions after the draft but before Opening Day
- In-season trade: players acquired via trade during the season
Now, at first glance, this data seems to suggest that you need to have most of your points – 60.7% of hitting points and 50.2% of pitching points – on your roster before the January 31 cut deadline. And, on average, that is what teams did. But check out this table:
| Acquisition Type | Minimum Number of Pitching Points | Minimum Number of Hitting Points |
|---|---|---|
| Kept | 0 | 0 |
| Pre-cut trade | -38.97 | -1.1 |
| Draft | 0 | 0 |
| Pre-season trade | -8.87 | -4 |
| Pre-season auction | -15.77 | -9.5 |
| In-season trade | -1.67 | 0 |
| In-season auction | 172.03 | 58.1 |
I apologize for the clunky title and column headers, but what this is showing is the mins for each acquisition type across all the champs. That’s right – there were champions that entered the auction with literally 0 points from players they kept from the prior season. There were teams that used pre-season auctions to pick up players who provided negative production and still went on to win a title.
Perhaps a little fascinating is that the only category where you had to have at least some production to end up on top was in-season auction. Everyone got at least something from there. But 58.1 points from hitters? That’s not likely a league-changer.
No, instead what this says is that you can build many ways and have a real shot to win. Hate your roster and want to start from scratch? You can win a title! Get too distracted in-season to work the wire much? You can win a title! Hate dealing with the auction draft? You can win a title!
On moving the other direction, teams were able to get huge chunks of points from multiple sources, as well:
| Acquisition Type | Maximum Number of Pitching Points | Maximum Number of Hitting Points |
|---|---|---|
| Kept | 6782.49 | 9289.4 |
| Pre-cut trade | 3746.1 | 4007.2 |
| Draft | 5673.33 | 7972 |
| Pre-season trade | 1554.23 | 2917.5 |
| Pre-season auction | 1827.03 | 1012 |
| In-season trade | 4778.67 | 4152.3 |
| In-season auction | 4399.68 | 4575.2 |
Championship teams had around 10K hitting and 8K pitching points, so you can see here, teams were able to get the majority of their points from both keepers OR the draft. For pitchers, they could also get a majority of their points in-season. For hitters, they could almost get a majority in-season. The only time of year you can’t really build an entire roster is between the draft and the start of the season and that makes sense – it is a short window with less activity.
Going through this data, I found teams that won without making a single trade, without keeping any productive players, without spending much in auctions, and more.
So as you are looking at your team’s the off-season and figuring out what to do, it is worth noting that the top teams often keep around half their total points from the previous season and have even more in place before the cut deadline – but that is hardly the only way to win and you have to do what makes sense for you.
A long-time fantasy baseball veteran and one of the creators of ottoneu, Chad Young's writes for RotoGraphs, and can be heard on the Keep or Kut Podcast. You can follow him on Bluesky @chadyoung.bsky.social.
Great article!
It’s interesting how the differences between the hitting chart and the pitcher chart support the idea that it’s easier to build a core of hitters via keepers & trades and supplement with pitching via auctions. For example:
Kept + all trades: 71% hitting vs. 59% pitching
Draft + all auctions: 29% hitting vs. 41% pitching
That is exactly what I took away from this. The other thing is that those offseason trades can be separators. Some people don’t even try to make them. But done well they can be a marvelous opportunity. In a H2H league I’d long dominated, I had too much salary last offseason and ended up trading Lindor and Soto for Gorman and Adolis…the teams that got Lindor and Soto played one another in the championship.