The Balance Between Called Strikes and Chase
In early June, Alex Chamberlain graced us with a FanGraphs article about Brendon Little and a new concept called, “Implied Miss Distance”. Chamberlain, along with Baseball Prospectus writer/researcher Stephen Sutton-Brown, have done some great work utilizing Statcast bat tracking data, giving readers a new perspective on something like a swing and miss. But, back in early July, nearly a month after Chamberlain wrote about Little’s amazing knuckle-curve and it’s ability to make hitters whiff so hard that the outfield flag flutters, hitters stopped chasing the pitch. They were tired of looking silly and would no longer budge, allowing us to imply nothing:
If it wasn’t for Chamberlain’s article, I wouldn’t have known about Little or his knuckle-curve. But that’s why FanGraphs is the best, and when I recently watched the Blue Jays and their relievers’ deteriorating August WHIP, I heard the broadcasters mention Little’s falling O-Swing, or chase, rate.
If you only focused on Little’s knuckle-curve and the damage hitters have done to it in each month of the season, as you see in the table below, you wouldn’t think twice about the pitch’s performance:
| Month | KC | Total Pitches | KC% | wOBA |
|---|---|---|---|---|
| Mar/Apr | 96 | 218 | 44.0% | .194 |
| May | 111 | 229 | 48.5% | .176 |
| Jun | 119 | 243 | 49.0% | .212 |
| Jul | 103 | 193 | 53.4% | .192 |
| Aug | 76 | 193 | 39.4% | .146 |
| Sep/Oct | 51 | 119 | 42.9% | .257 |
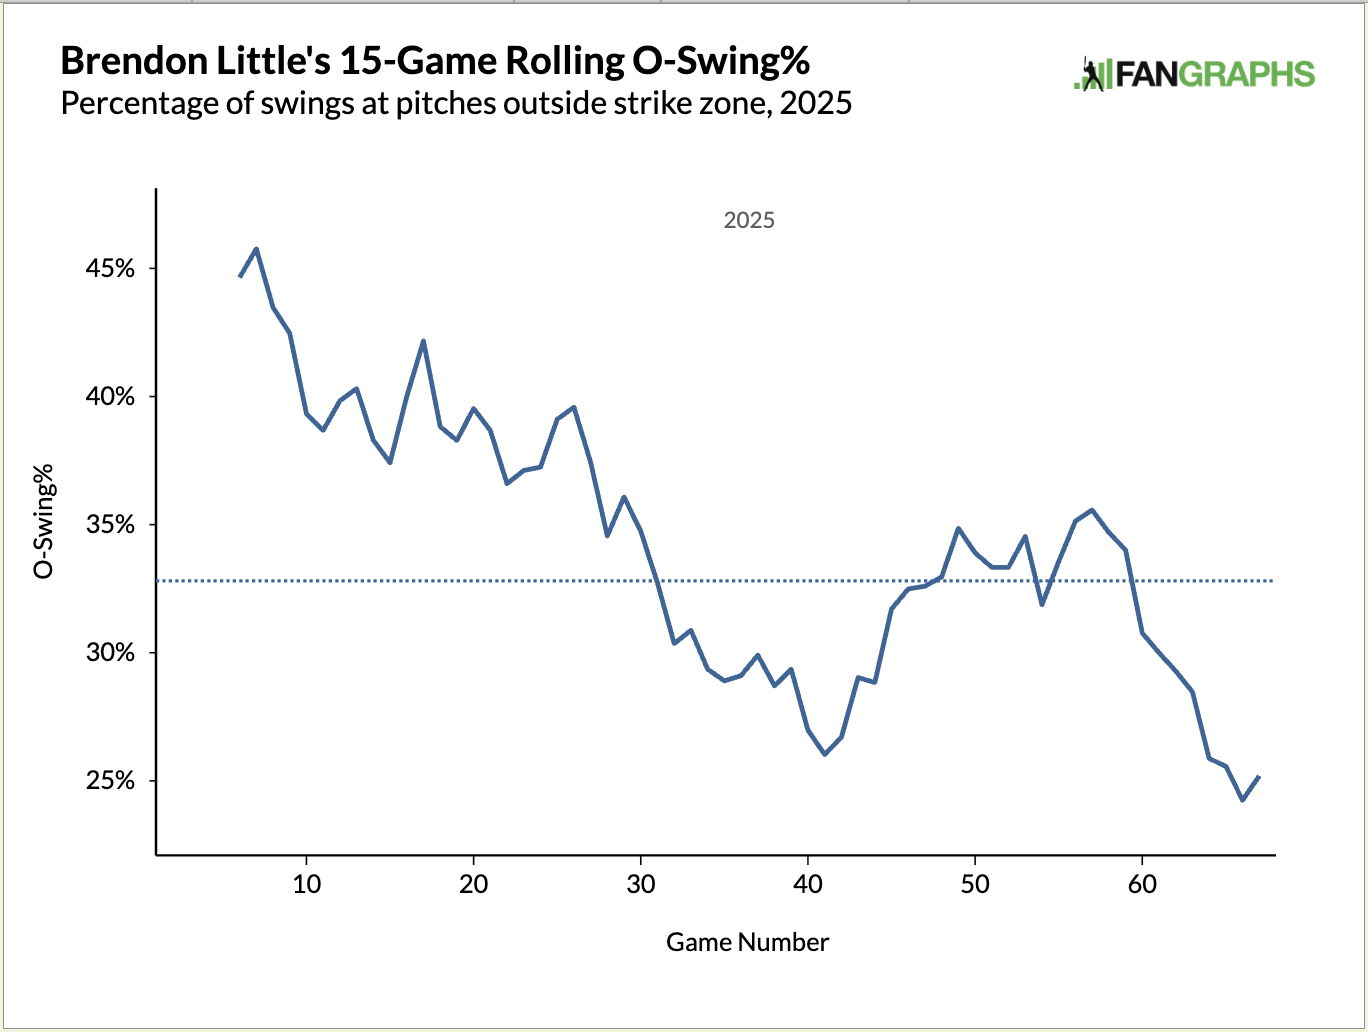
Among pitchers who have thrown at least 100 knuckle curves in any of the last five seasons, Little’s 2025 wOBA of .188 is a fringe top 20 (25th) out of nearly 200 pitchers. Last season, Little got even closer to the top 20 mark (23rd) with a .186 wOBA on the pitch. But the broadcast never said anything about Little getting hit; they were focused on the lack of chase and, therefore, an increased BB%:
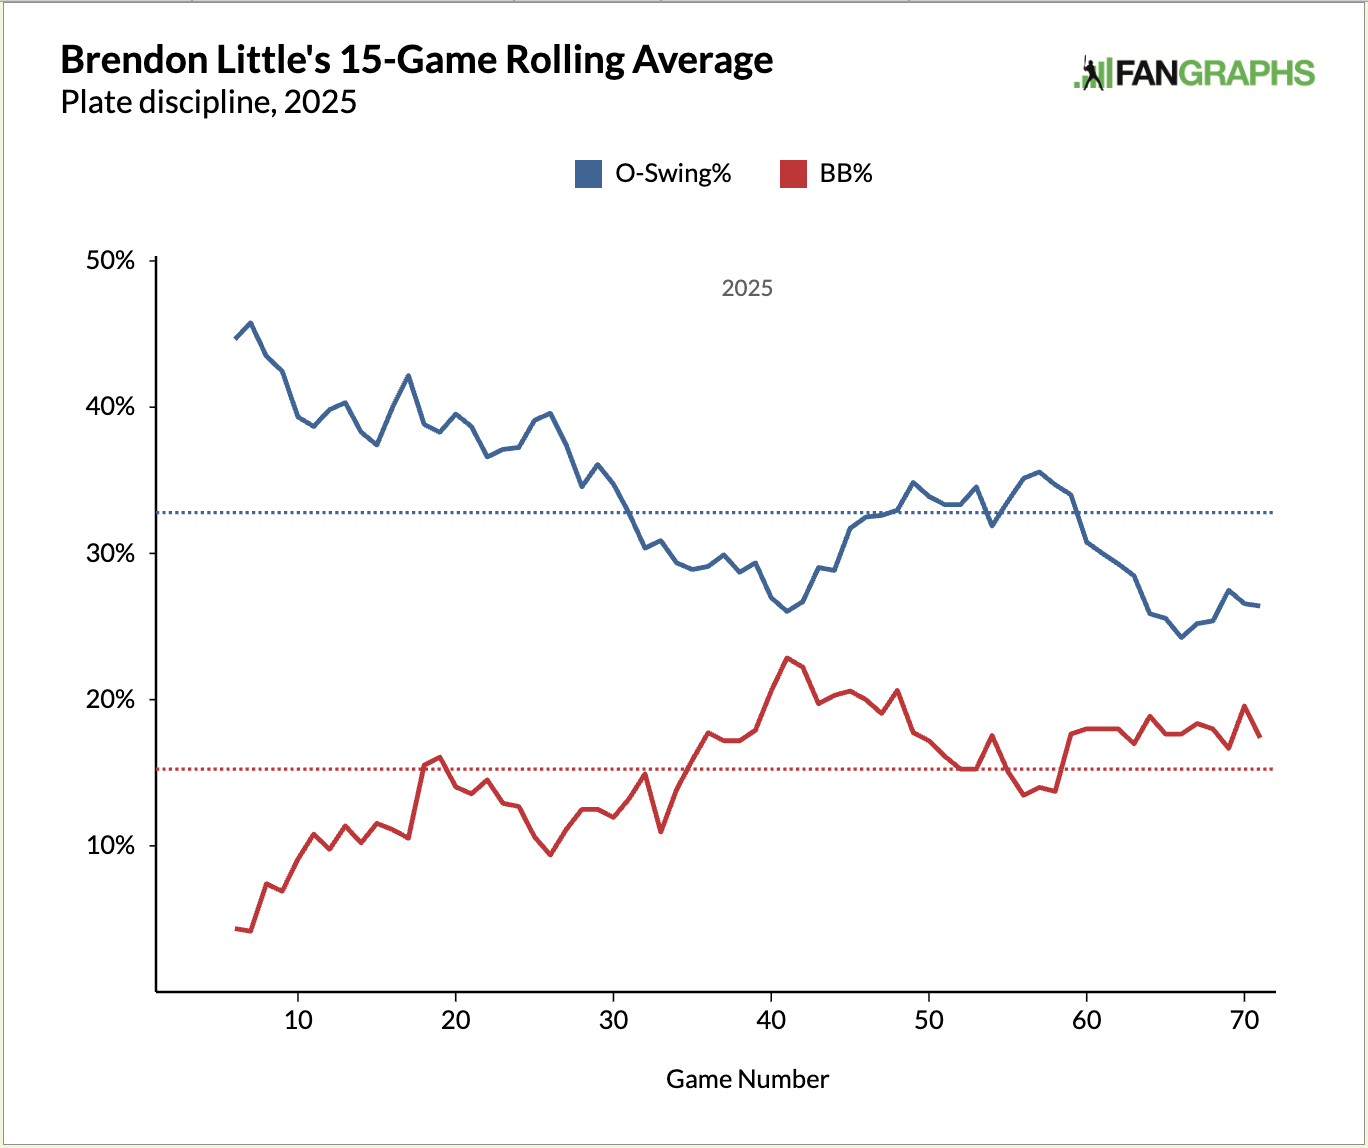
The chart above includes all of Little’s pitches. By isolating the O-Swing% to only his knuckle-curve, we can see that this overall drop in hitters’ chasing after Little’s offerings wasn’t solely because of them spitting at that specific pitch:
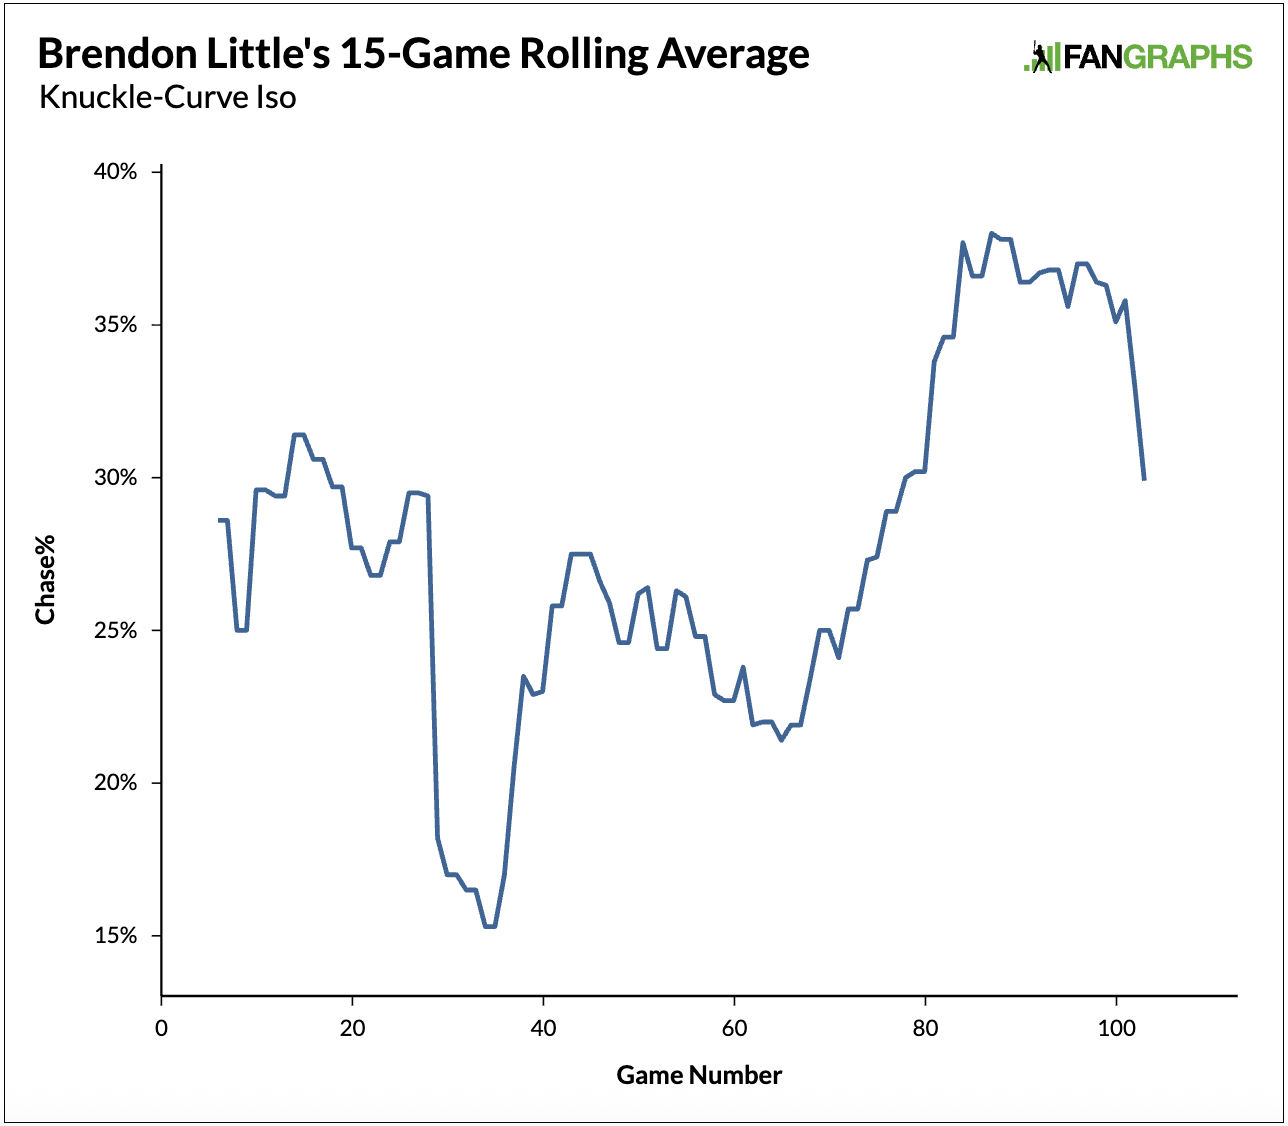
Thanks to the incredible addition of the Pitch-Type Split Leaderboard by the FanGraphs web team, we can now view the averages of individual pitches with ease. In 2025, among all pitchers who have thrown at least 10 knuckle curves, the league average O-Swing% currently sits at 35.5%. Little’s mark on the season is 36.5%. Rolling averages are different from season averages, and when Little’s chase rate rolling average dipped, so did the chase rolling average of his two other pitches:
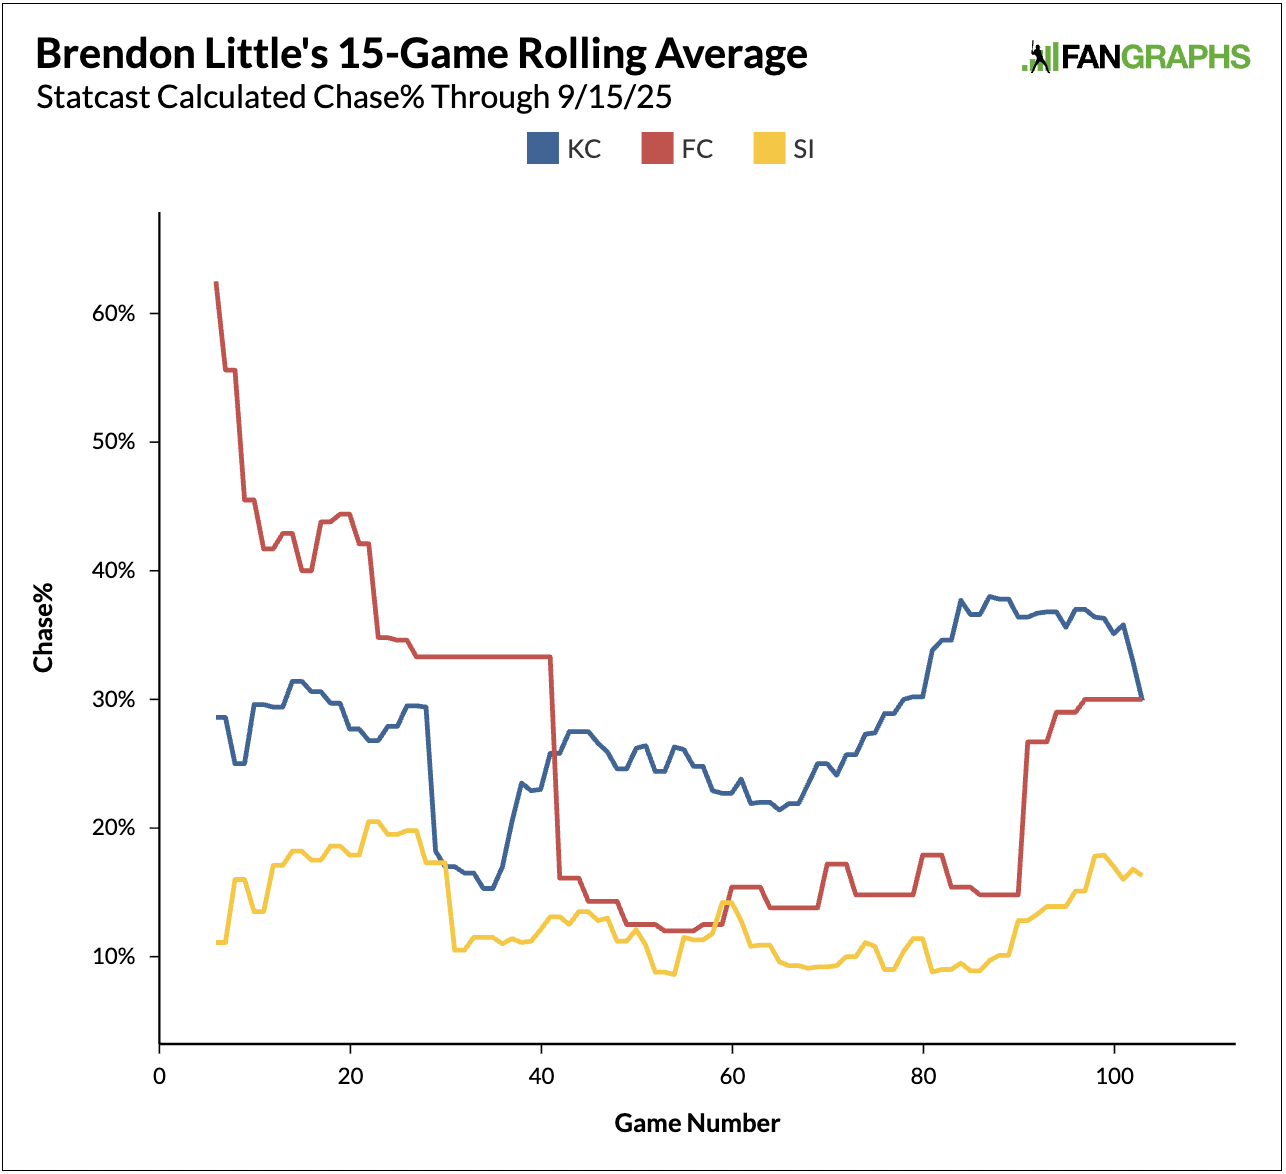
Chart 4 – Rolling KC, FC, SI Chase% Comps
The straight red line indicates times when Little stopped throwing his cutter. It’s interesting to see how the line stopped running horizontally around the same time his knuckle-curve was at its worst. Unfortunately, it didn’t fill the chased pitch gap, and that 40-50 game mark fell around early to mid-July when Little’s WHIP went upwards:
| Month | KC% | WHIP | K-BB% |
|---|---|---|---|
| Mar/Apr | 44.3 | 1.31 | 26.8 |
| May | 48.5 | 0.98 | 17.3 |
| Jun | 49.0 | 1.42 | 15.7 |
| Jul | 53.4 | 1.60 | 21.3 |
| Aug | 39.4 | 1.65 | 0.0 |
| Sep/Oct | 42.9 | 1.65 | 10.0 |
Hitters weren’t getting boosted wOBA’s from Little’s lack of chase, but the 1.65 WHIP (5.97 eqiuv. ERA) meant they were hitting his other pitches and walking more. I’ve been rambling on about Little for more than a few paragraphs now, and you’re probably waiting for the point. The point? The point is, pitchers need to adjust when a pitch that used to be chased no longer gets chased. They know that. We know that. Yet, it’s difficult to keep track of on the fan side of things. Pitchers will go about adjusting in all sorts of ways.
In Little’s case, it was really just a blip. If you go back up to the graph showing individual pitch chase rates, you may notice that Little’s usage of the cutter, even if it wasn’t chased, allowed the chase rate on his knuckle-curve to jump back up. Hitters did a great job of laying off Little’s knuckle-curve from around games 30 to 70, but excellence is when a pitcher can adjust in the moment to hitters. That’s robotic. So, let’s!…get!…robotic! For the remainder of this article, I’ll present a detection system that can run daily to capture when a pitcher’s most used fastball and most used secondary are in good or bad rhythm using individual pitch plate discipline metrics. Here’s an example from Little’s 40 to 80 game span:
| Game Number | Rolling_CStr%_SI | Rolling_Chase%_KC | Performance |
|---|---|---|---|
| 41-50 | 26.8 | 23.4 | Ok (Adjusting) |
| 51-60 | 21.1 | 25.8 | Bad |
| 61-73 | 16.9 | 21.8 | Bad |
The table is just a summary of what you see in Chart 4 above, but it’s designed to be placed in an automated system. If chase is up on one pitch and called strike is up on another, that’s good. If both pitches are falling to generate either chase or called strikes, well, that’s bad. Categorizing the balance between his sinker’s called strike rate and his knuckle-curve’s chase rate is as simple as creating rule-based logic:
conditions = [

(final_df['Rolling_Chase%']-3 > final_df['smart_median_chase']) & (final_df['Rolling_CStr%']-3 > final_df['smart_median_cstr']),

(final_df['Rolling_Chase%'] <= final_df['smart_median_chase']) & (final_df['Rolling_CStr%'] >= final_df['smart_median_cstr']),

(final_df['Rolling_Chase%']+3 < final_df['smart_median_chase']) & (final_df['Rolling_CStr%']+3 < final_df['smart_median_cstr']), (final_df['Rolling_Chase%'] >= final_df['smart_median_chase']) & (final_df['Rolling_CStr%'] <= final_df['smart_median_cstr'])

]

# Define the corresponding categories

categories = [

'Excellent',

'Ok (Adjusting)',

'Bad',

'Ok (Adjusting)'

]
Using the pitcher’s median values allows the categorization to detect improvements by each individual. I’m using “smart” medians to call the league median if a player has a zero value. That happens when they haven’t generated any chase or called strikes. If we use Brendon Little’s game logs to isolate his performance during those game periods from the table above, we see some pattern in a very small sample:
| Game Number | WHIP | K-BB% |
|---|---|---|
| 41-50 | 0.91 | 32.3% |
| 51-60 | 2.10 | 0.0% |
| 61-73 | 1.33 | 15.4% |
Little was at his best when he was in decent balance. This is the type of tracking that could be useful when streaming pitchers or looking for hot relievers. To test this out on a grander scale, I built a dataset that includes data from the last two months. This keeps the sample limited to more recent performance. Furthermore, I limited the data to only pitchers with more than 60 total pitches thrown in that time. Then, I took each pitcher’s most utilized fastball by pitch percentage and used it to calculate their called strike rate. I did the same with each pitcher’s most utilized offspeed, or non-fastball, pitch and used it to calculate their chase rate. I then calculated each pitch’s 15-game rolling rate, called strike for fastballs and chase for non-fastballs, and labelled their performance balance. Finally, I counted the number of days in which a player has been either good (balanced) or bad (unbalanced) and found the current status of players in both groups:
| Player | Rolling CStr% | Rolling Chase% | Days of Excellence |
|---|---|---|---|
| Emilio Pagán | 14.4 | 31.7 | 5 |
| Dennis Santana | 32.1 | 24.3 | 2 |
| Tanner Scott | 14.0 | 22.3 | 2 |
| Jared Koenig | 32.2 | 22.0 | 3 |
| Yerry De los Santos | 21.7 | 20.0 | 2 |
–
| Player | Rolling_CStr% | Rolling_Chase% | Days of Poor Performance |
|---|---|---|---|
| David Robertson | 7.7 | 12.9 | -16 |
| Carlos Hernández | 0.0 | 4.0 | -2 |
| Trey Yesavage | 23.1 | 16.2 | -1 |
| Joe Rock | 31.8 | 18.5 | -1 |
| Andrew Hoffmann | 12.8 | 0.0 | -2 |
The results focus on a pitcher’s most recent stretch. For example, Emilio Pagán has had one of his best K-BB% (22.4%) marks of his career this season, and in his last five games, it’s been even better (26.3%). He’s had recent success thanks to his four-seam and splitter working in unison.
Is there more to do? Always. I’ve only compared fastball called strike rates with offspeed chase rates, but all of these plate discipline metrics could be compared for balance. For example, it may be better to have a balanced swinging strike rate and chase rate. But, fundamental to this analysis is the assumption that it’s hard to get anywhere without a fastball and offspeed pitch that work well together. Does it mean anything? Is the balance even predictive of future success? Maybe, maybe not. What it certainly can do, as I believe I’ve exemplified here, is explain a pitcher’s success or lack thereof. If you are interested in doing this analysis on your own without spending hours calling and pinging pybaseball’s API, you can view pitch-specific plate discipline metrics on our new and totally awesome Pitch-Type Splits Leaderboards. Stay balanced, stay cool.