Step Aside, Statistics. It Is Physics Time.
Since the beginning of December I have been working on an updated method to estimate home run probability. This method will be built around a physics model, compared to real life ballpark dimensions, and then evaluated using known sources of error. Especially for the coefficients of drag and lift.
As a first step, I reverse engineered Alan Nathan’s trajectory calculator. I then built my own version of the calculator, excluding wind, but including a few other features that his lacks. You can read about that here and look at my calculator here.
Once I felt I had fully grasped the necessary physics, I set forth and rewrote the calculator as a stored procedure in my database, and I ran it on all of the batted ball data I currently have. I have exported this data and used it to create the viz you see towards the bottom of this article. But first, there are a few things I need to address.
Recently there have been a few articles on Rotographs talking about the missing Spinrate stat, and the difficulty of predicting home run rates. You may have also seen Tom Tango tweet about spray angle versus horizontal angle*.
* The “Horizontal angle” most people use might actually be better referred to as ‘bearing’, the angle between home plate and the point at which the ball lands. True horizontal angle, ie the angle off the bat, is not publicly available information at the moment. Furthermore, the ‘bearing’ I and many others are calculating is a very rough estimate. Trackman directly measures both bearing and horizontal angle, but neither are published for public consumption. Hopefully that changes in the future. Note that Tom is referring to ‘bearing’ as ‘spray.’ They are roughly interchangeable terms. Horizontal angle should be considered the angle off the bat.
#Statcast
Spray: Direction at Launch compared to at Landing
By Distance
RHH only pic.twitter.com/5DoQLWqRTy— Tangotiger (@tangotiger) December 21, 2017
Notice how -12 degrees is roughly equal to “straight” in terms of the ball’s spin. That would mean at around -12 degrees of spray angle the ball has primarily backspin with very little side spin. A bit like a four seam fastball. Note that this data is lined up for a right handed batter and -12 degrees is just to the left field side of center field. Quick rule of thumb, the width of your fist at arm’s distance is about ten degrees. The width of your middle and index finger at arm’s length is roughly equal to five degrees. So 12 degrees is about the width of your fist plus a finger. That’s how far off center field is equal to “straight” for a batted ball.
I drew 12 degree lines on Dodger Stadium below to give you a more visual sense.

Okay, so, the further you get from this 12 degree angle, the more the ball slices and hooks. Since we don’t have access to the actual horizontal angle data, we have to work backwards from the offsets provided by Tom Tango in his tweet. You first find the bearing angle, where the ball landed/was fielded. Then you apply the offsets provided by Tom, to hopefully arrive at an initial angle. Then you can run that through a physics calculator to see if you get the starting bearing angle. This is a bit of a nightmare at the moment, and it is a problem I don’t want to touch with a ten foot pole.
Let’s move on to my Viz.
(The viz doesn’t appear to be drawing on mobile devices, I don’t know why, you can view an image here).
I have set this viz to default on a smaller range of values. You can play with the sliders on the bottom to change those values.
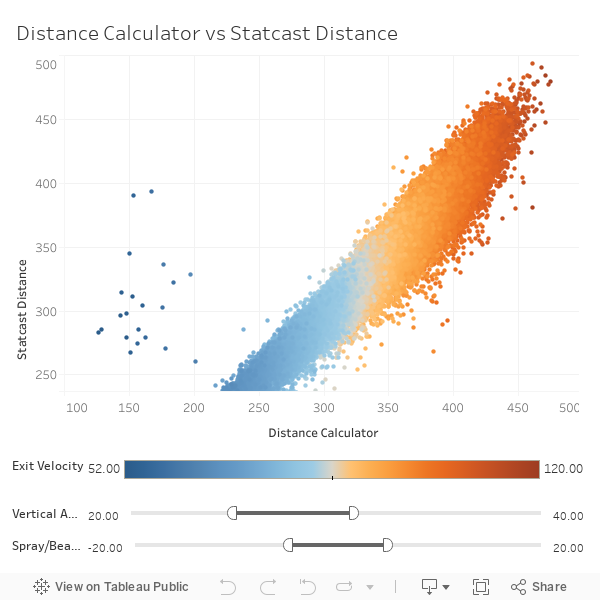
The X axis shows the distances spit out by my physics model, which is very similar to the one used by Alan Nathan. The Y axis shows the distance measured by Statcast.
The calculator is assuming that all batted balls have 2500 rpm backspin and either 900 or -900 rpm side spin, depending on the batter handedness. These values are likely towards the high end of actual measured spin rates, but I don’t have the data to back that up.
The color is exit velocity. The color is only there for visual interest, it doesn’t mean much, but it makes the graph look pretty.
For this more narrow band of values, the calculator and Statcast have good agreement on batted ball distance. Note that there are a group of balls hovering above the main sequence, many of them have exit velocities in the mid 50s and measured distances in the 400 foot range. They may be measurement errors of some sort.
All in all, though, this is doing pretty well. Note that wind is not factored into the calculator, which could increase accuracy when added (easier said than done). Furthermore, there appear to be natural variations in the coefficients of drag and lift, which could change the flight characteristics of the ball by a decent margin, perhaps 30 feet in either direction. Those fluctuations could explain much of the differences as well. And, of course, the spin rate is a real factor.
Even still, with the assumptions being made, the calculator is doing well.
Now, try looking at balls with a wider field of spray angle. The default is -20 to 20 degrees. Try looking at -40 to 40. The chart doesn’t change very much. You can jump to -50 to 50, which would cover the whole field, and even still it doesn’t change that much. The error becomes larger with a wider field of angles, but not by a tremendous amount.
Try pushing the upper side of the vertical launch angle. Push it from 40 degrees to 90 degrees and see what happens. Doesn’t change too much, right?
Try lowering the vertical launch angle. I have it set to 20 degrees. Drop it to 0 degrees. Uh oh, what’d you do?! You broke it! Just kidding.
At the lower launch angles we have more error on batted ball distance. It isn’t the horizontal angle that is adding so much error, which might be surprising. Maybe side spin isn’t very important after all. At least not when looking at general batted ball distances, it could matter quite a bit when looking at boundary conditions (ie, homerun versus not homerun).
The calculator is currently assuming a pretty high spin rate for batted balls. Which seems to estimate fly balls well, since fly balls tend to have a high spin rate. It underestimates pop ups, since pop ups tend to have an even higher rate, but pop ups don’t matter much, so that isn’t a big deal.
But line drives, well, it appears their spin rates must be much lower. In Alan Nathan’s experiments, launch angles around 10 degrees have about half the spin rate of those in the 20-30 degree range.
I entered a line drive into my calculator (Comerica Park, 70 degrees, 50% humidity, 29.92 inHg, 104 mph EV, 15 degree vertical angle, 0 degree spray angle). At 2500 rpm, the ball is estimated to travel 369 feet. At 1200 rpm the estimate falls to 333 feet. A huge difference. In fact, this difference is large enough to erase much of the error seen at the lower launch angles, and in the future I will include a 1200 rpm bucket for these line drives.
There is one caveat to everything about this research, though:
Statcast distance measurements are not perfect.
Each distance measurement comes with an accompanying number that expresses the confidence in the measurement. That confidence is very important for research and analysis purposes, but it is not published for public consumption. Which forces us to take all of the numbers at face value. These distance numbers were never intended to be used in this manner, and it can lead to a lot of, frankly, bad interpretations.
But this is all we have to work with, so for the time being we have to lug around a large grain of salt everywhere we go.
In the coming future, I will complete my models for all 30 stadiums, and then I will begin testing my calculator as a home run estimator. That is when horizontal angle and spin rates will become exceptionally important. For distance, though, if you’re only looking at fly balls, especially fly balls towards the middle of the field, then the assumptions made thus far appear to be good enough. I can’t wait to share this research with everyone when it is complete.
Andrew Perpetua is the creator of CitiFieldHR.com and xStats.org, and plays around with Statcast data for fun. Follow him on Twitter @AndrewPerpetua.
Wow.
I haven’t been able to find this anywhere but how much slower is a HR ball going when it lands than when it’s hit?
Um, well, that depends on a whole lot of things. You can look at that calculator I posted at the top and enter in numbers and scroll down to the bottom to see how fast it is going. It will be in feet per second, though. That default line drive goes from 152 to 80 feet per second, though. So that is like 104mph to 55mph or whatever.
That makes sense then, I always wondered how anyone in the bleachers is catching HR balls with bare hands, but catching a 55mph ball, while still coming in fast, is much easier than 100mph
Your title immediately brought this to mind (from the XKCD store).
That is definitely what I was going for. 😛
I really like your choice of title. It appeals to my prejudice that baseball analytics can benefit a great deal from physics-based (as opposed to statistics-based) analysis.