Searching For The Best Reliever Release Point
Let’s imagine that Jacob deGrom is pitching for the New York Mets and has just faced the number nine batter his second full time through the order. Let’s also imagine, and this one is hard to do, that deGrom isn’t himself this fine day and shouldn’t go through the order a third time. Manager Luis Rojas pulls a hot dog style folded paper out of his back pocket and looks at multi-colored charts, doodles, heat maps, and whatever analytical imagery made its way into tonight’s report. Could the image below ever make its way onto that paper?
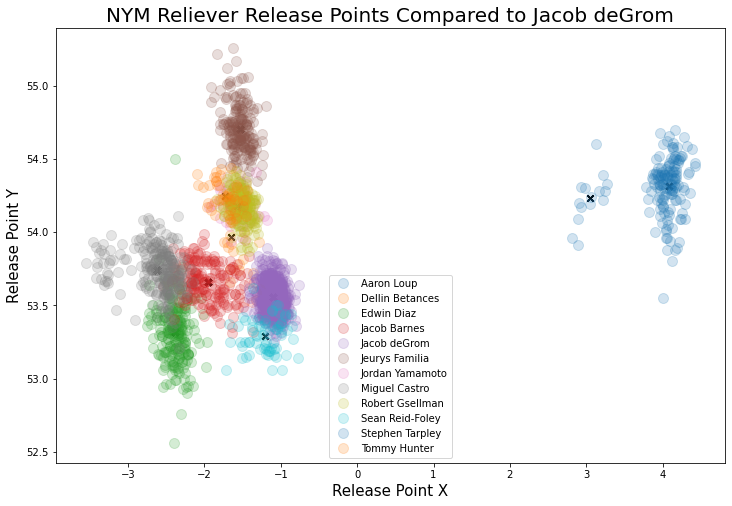
This graph of release points shows deGrom’s release points this season (2021) and all the available relievers and their release points this season. Could this be useful? If you played as a kid you may remember you and your teammates, fingers clinging to a chain-link fence, staring at the next pitcher as he warmed up. “What’s he got?” you would ask your friend, or, “Whoa, he’s way more hit-able than that first kid! Yes!” deGrom, in this sense, would be like that oversized 5th grader that everyone really knew was actually supposed to be in 6th grade by now. The point is, the hitters have now seen deGrom twice, have studied his release point, and have tried their best to hit something. But, now that there has been a change, they’ll need to adjust.
If you were Luis Rojas and you only had the above image to look at, let’s say we’re in a vacuum and everything else is equal, which reliever would you choose? If it were me, I would choose the reliever whose release point is furthest away, or the most different, from deGrom. I think it makes sense to bring in a totally different look and force the hitters to make the most extreme adjustment available.
Disclaimer: This is the start of an experiment. I’ll be using a small sample, there will be a lot of noise. No, baseball is not played in a vacuum, and no, I don’t have a press badge. But, stay tuned! I hope to develop and test this theory over a few posts. To the data!
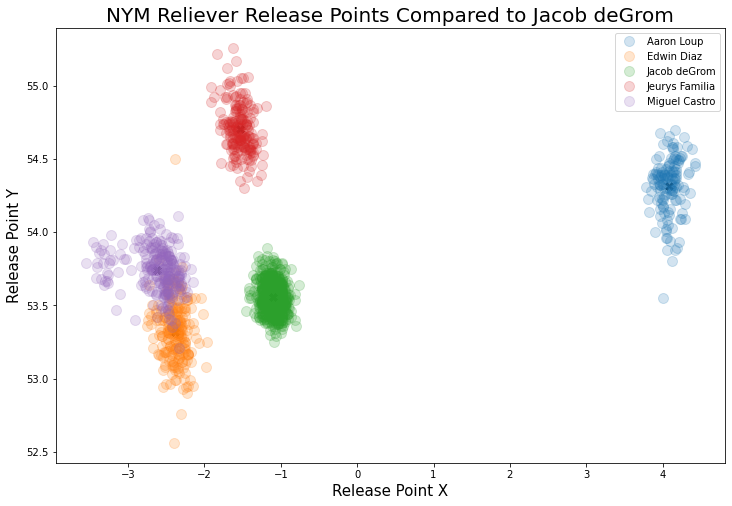
My theory is that a first reliever, or the pitcher that comes directly after the starter, with a vastly different release point from the starter, will perform better than a first reliever with a similar release point to the starter. Was that a mouthful or what? I’ll start with all Mets pitchers who have appeared directly after deGrom in either 2020 or 2021 and who are still with the Mets. If there’s anything to this, it will be hard to utilize any findings with pitchers who no longer pitch for the Mets. Here is a view of just the pitchers who meet these requirements:

DeGrom
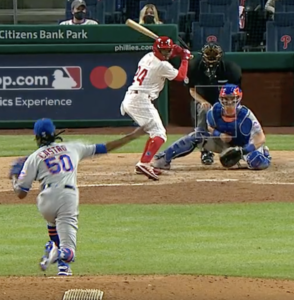
Castro
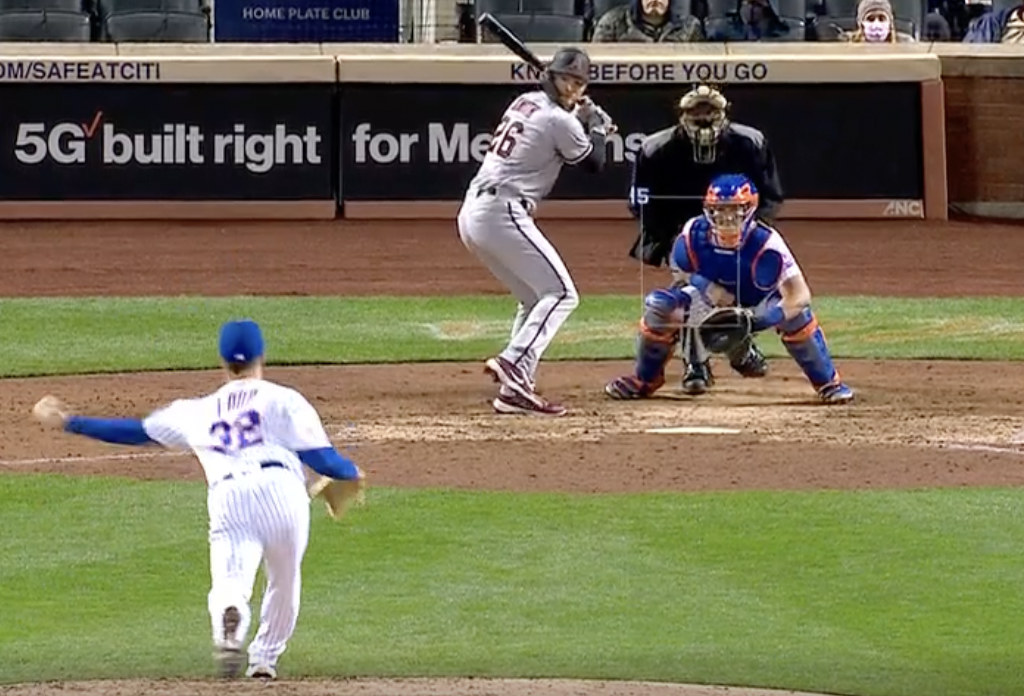
Loup
Aaron Loup is a lefty and has the most dissimilar release point to deGrom in the bullpen. Both Miguel Castro and Edwin Diaz have release points most similar to deGrom, with Jeurys Familia a little higher but in the same area horizontally as deGrom. Here’s how these pitchers have performed when they followed deGrom:
| W | L | SV | HLD | IP | TBF | H | R | ER | HR | BB | SO | |
|---|---|---|---|---|---|---|---|---|---|---|---|---|
| Jeurys Familia | 0 | 0 | 0 | 1 | 0.3 | 8 | 3 | 1 | 1 | 0 | 2 | 2 |
| Miguel Castro | 0 | 0 | 0 | 2 | 3.0 | 14 | 2 | 0 | 0 | 0 | 2 | 2 |
| Edwin Diaz | 0 | 0 | 1 | 0 | 1.2 | 9 | 4 | 2 | 2 | 0 | 1 | 0 |
| Aaron Loup | 0 | 0 | 0 | 0 | 1.0 | 3 | 1 | 0 | 0 | 0 | 0 | 1 |
This is an incredibly small sample. It needs to be done on aggregate across a much, much larger dataset. But, we can at least use this to begin testing the theory. It looks like Aaron Loup certainly had success when he followed deGrom. Could that be the lefty after a righty effect? Could it be that the hitters needed to make a much larger adjustment for Loup than they did for Castro? Could Loup just be a better reliever? Is this too small of a sample to make any conclusions? I’ll answer that last one again, yes. For now, I’ve poked my head down the rabbit hole. In order to jump in, I’m going to structure a dataset that will show me a few years of starters, first relievers, their difference in release points, and the performance of the reliever. From there, I’ll essentially have the start of an A/B hypothesis test and that will likely be the subject of my next post. Stay tuned for more.