Savant Hitter Aging Curves & Improvement Chances
This article is a data dump of some Baseball Savant-based aging curves, several “normal” curves along with some player improvement chances. There is no actual player analysis but instead, this article is to be a reference for future player breakdowns.
The main reason behind this study is to have an answer to: “If only player X increased their Launch Angle/Hard Hit Rate/Barrel Percentage, they could take a step forward. Here is an attempt to put some numbers to those “ifs”.
To start with, here are the aging curves for the following stats:
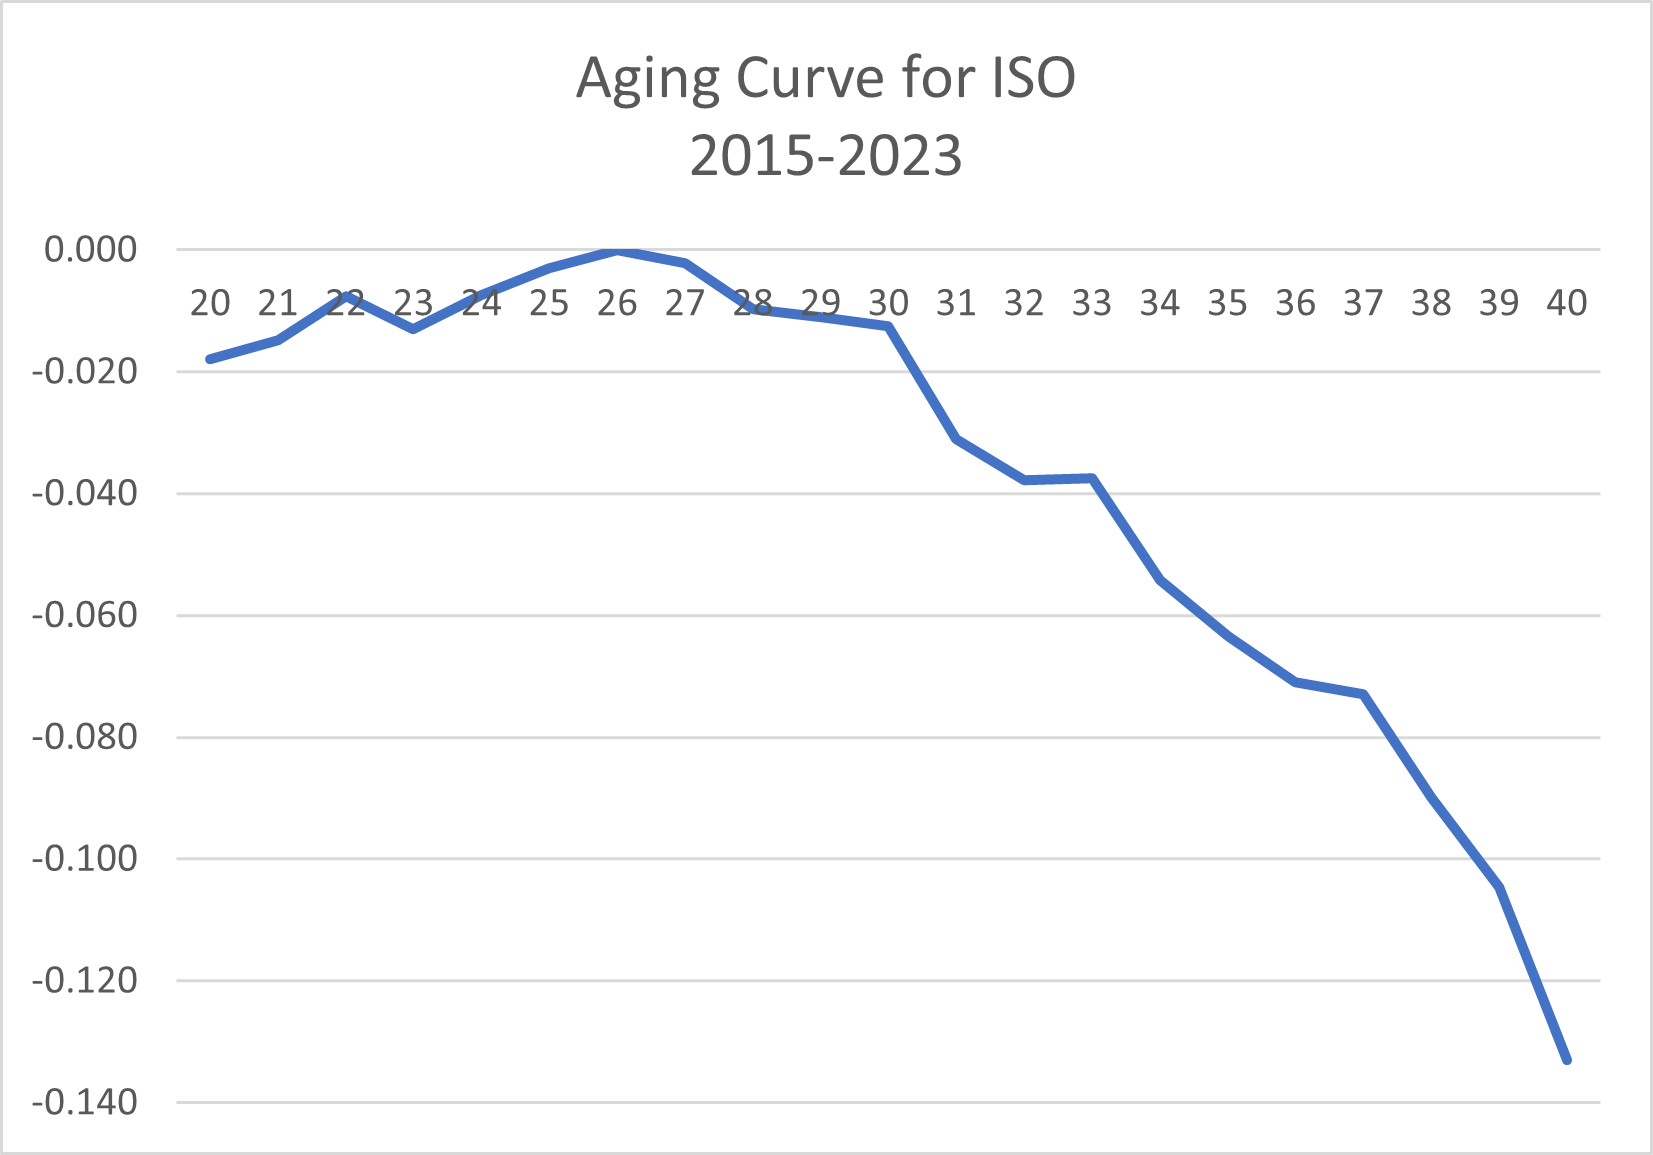
- Isolated Power (ISO)
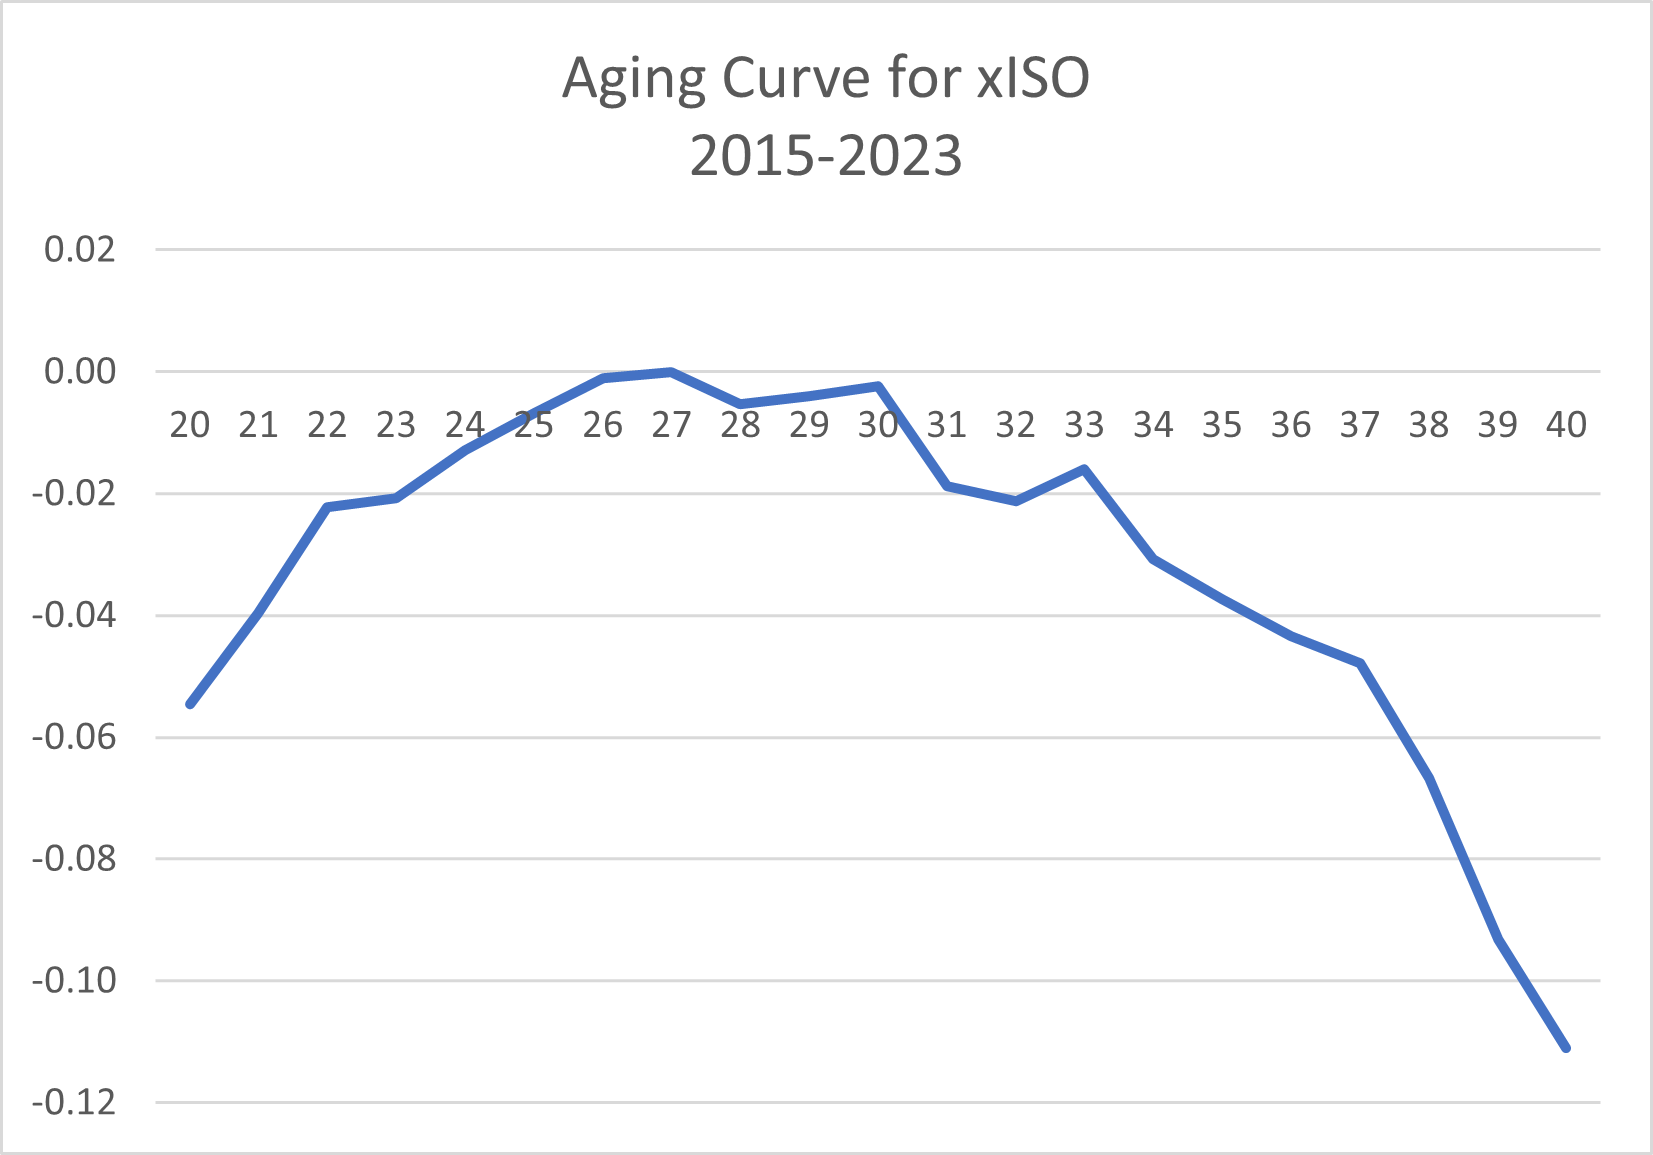
- ISO (xSLG-xAVG): The reason I included xISO is that it doesn’t have a speed component included like ISO. Part of hitting for doubles and triples is having decent speed.
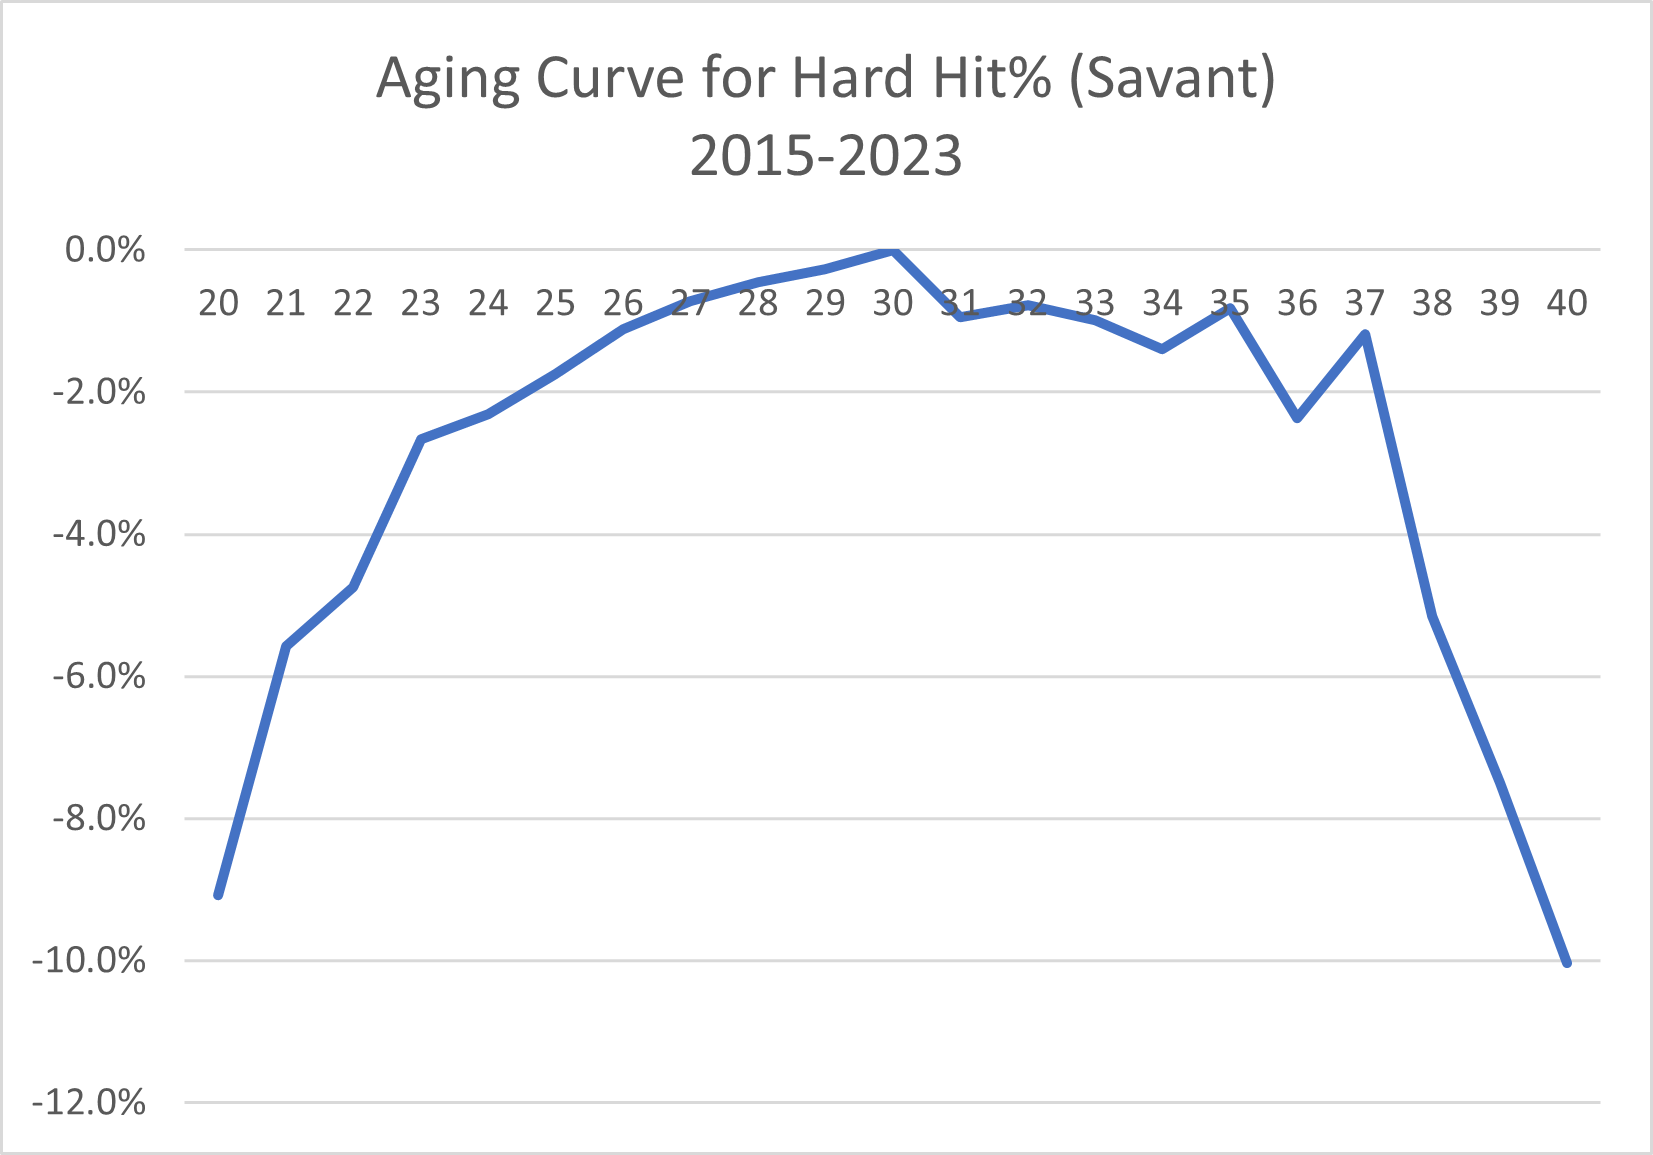
- Hard Hit%: The Savant version.
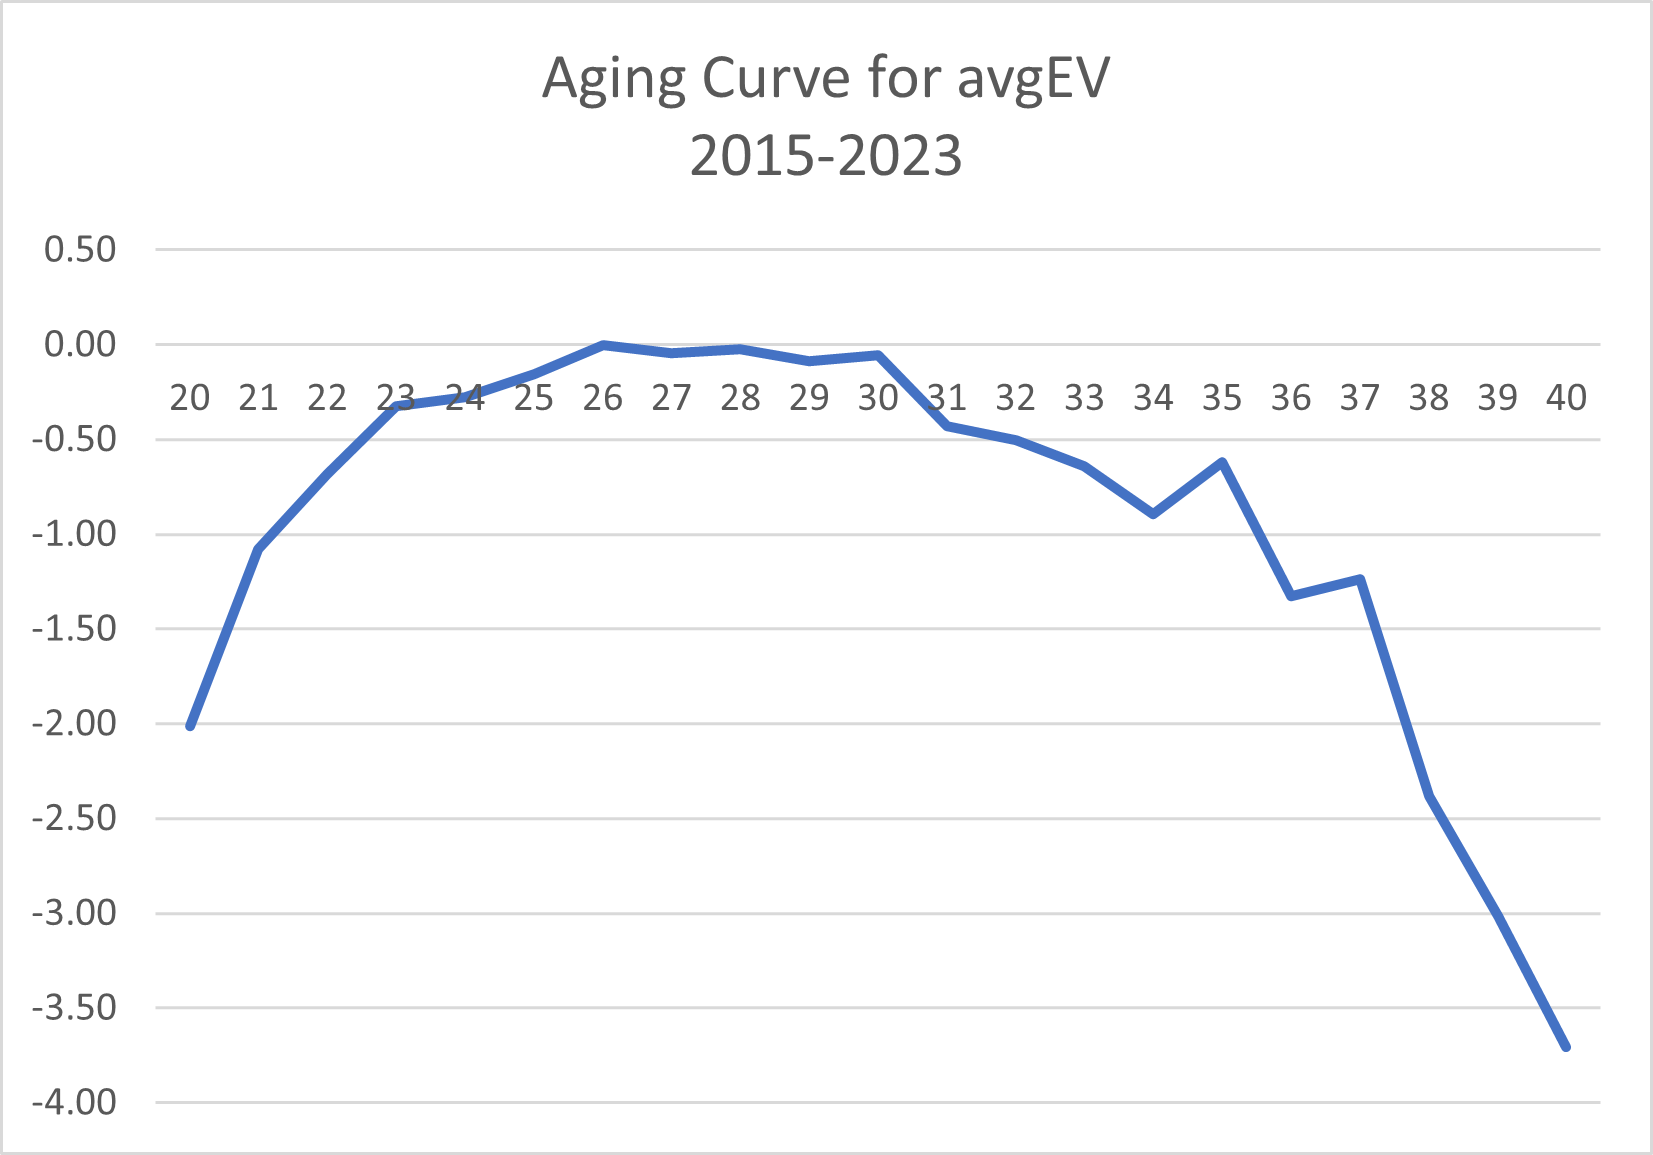
- Average Exit Velocity (avgEV)
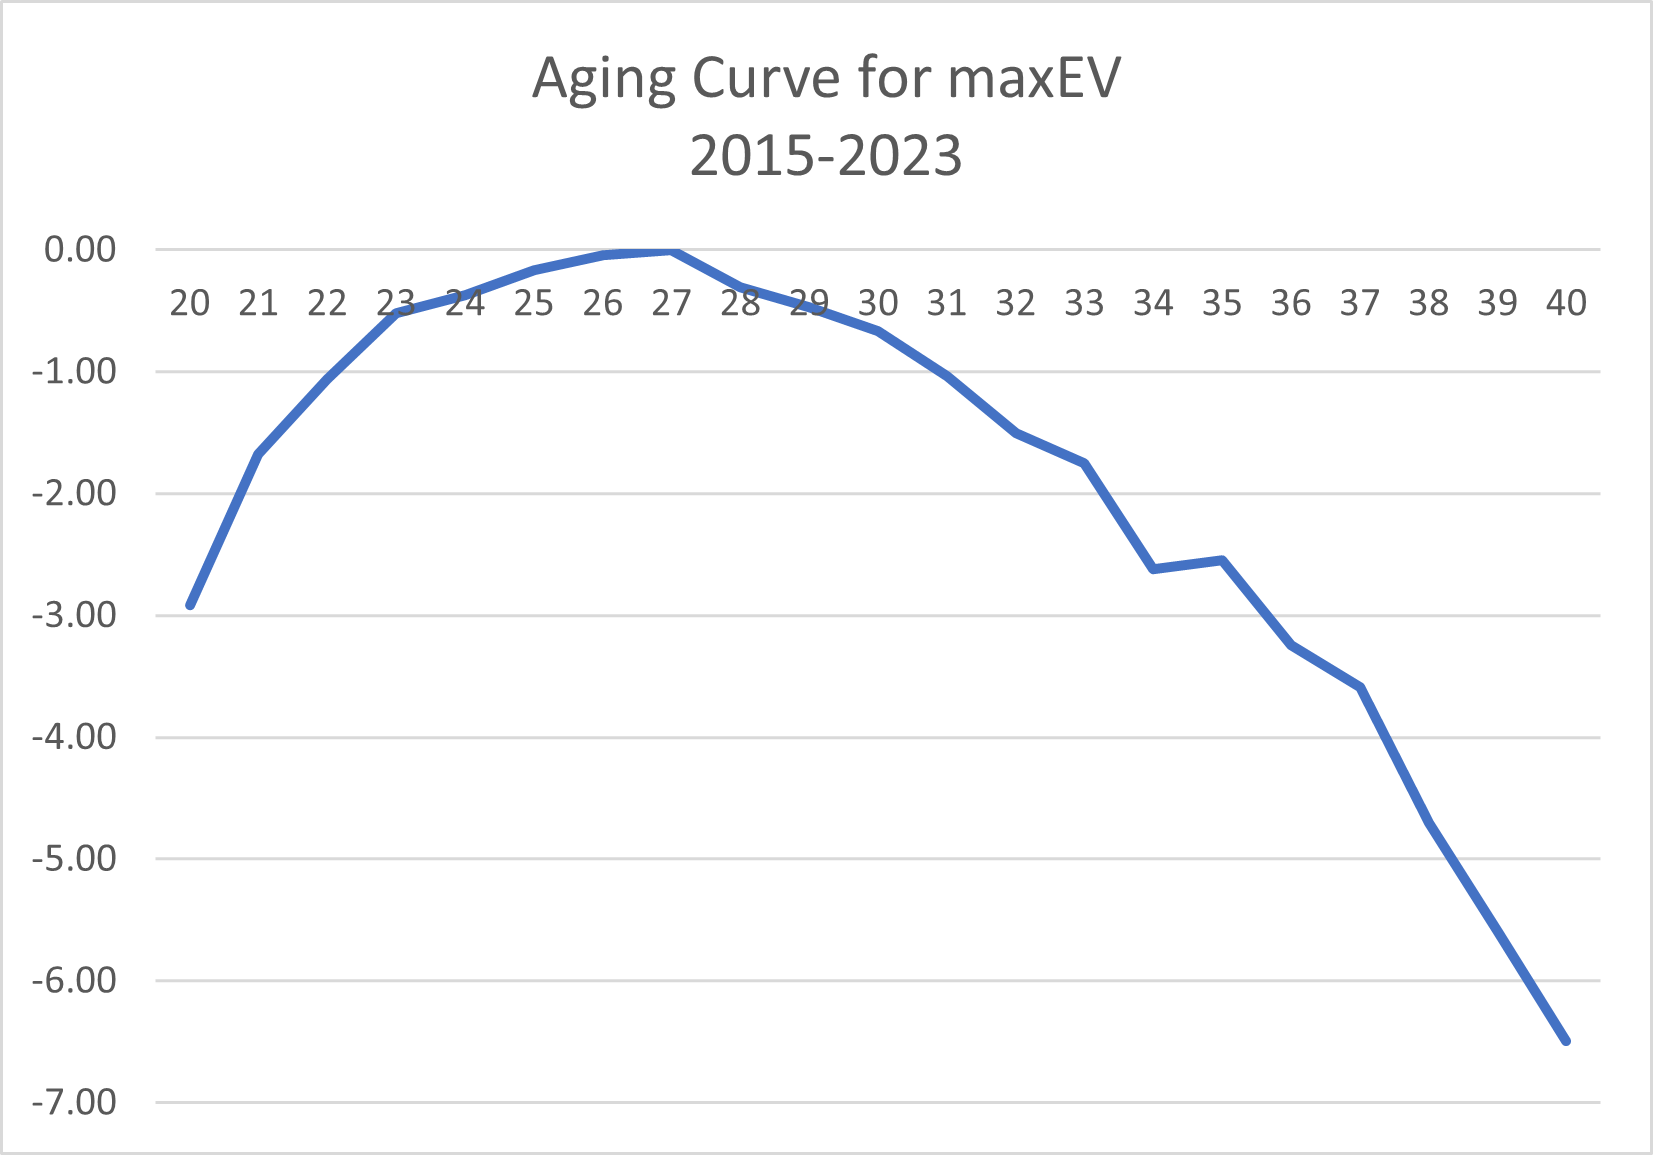
- Maximum Exit Velocity (MaxEV)
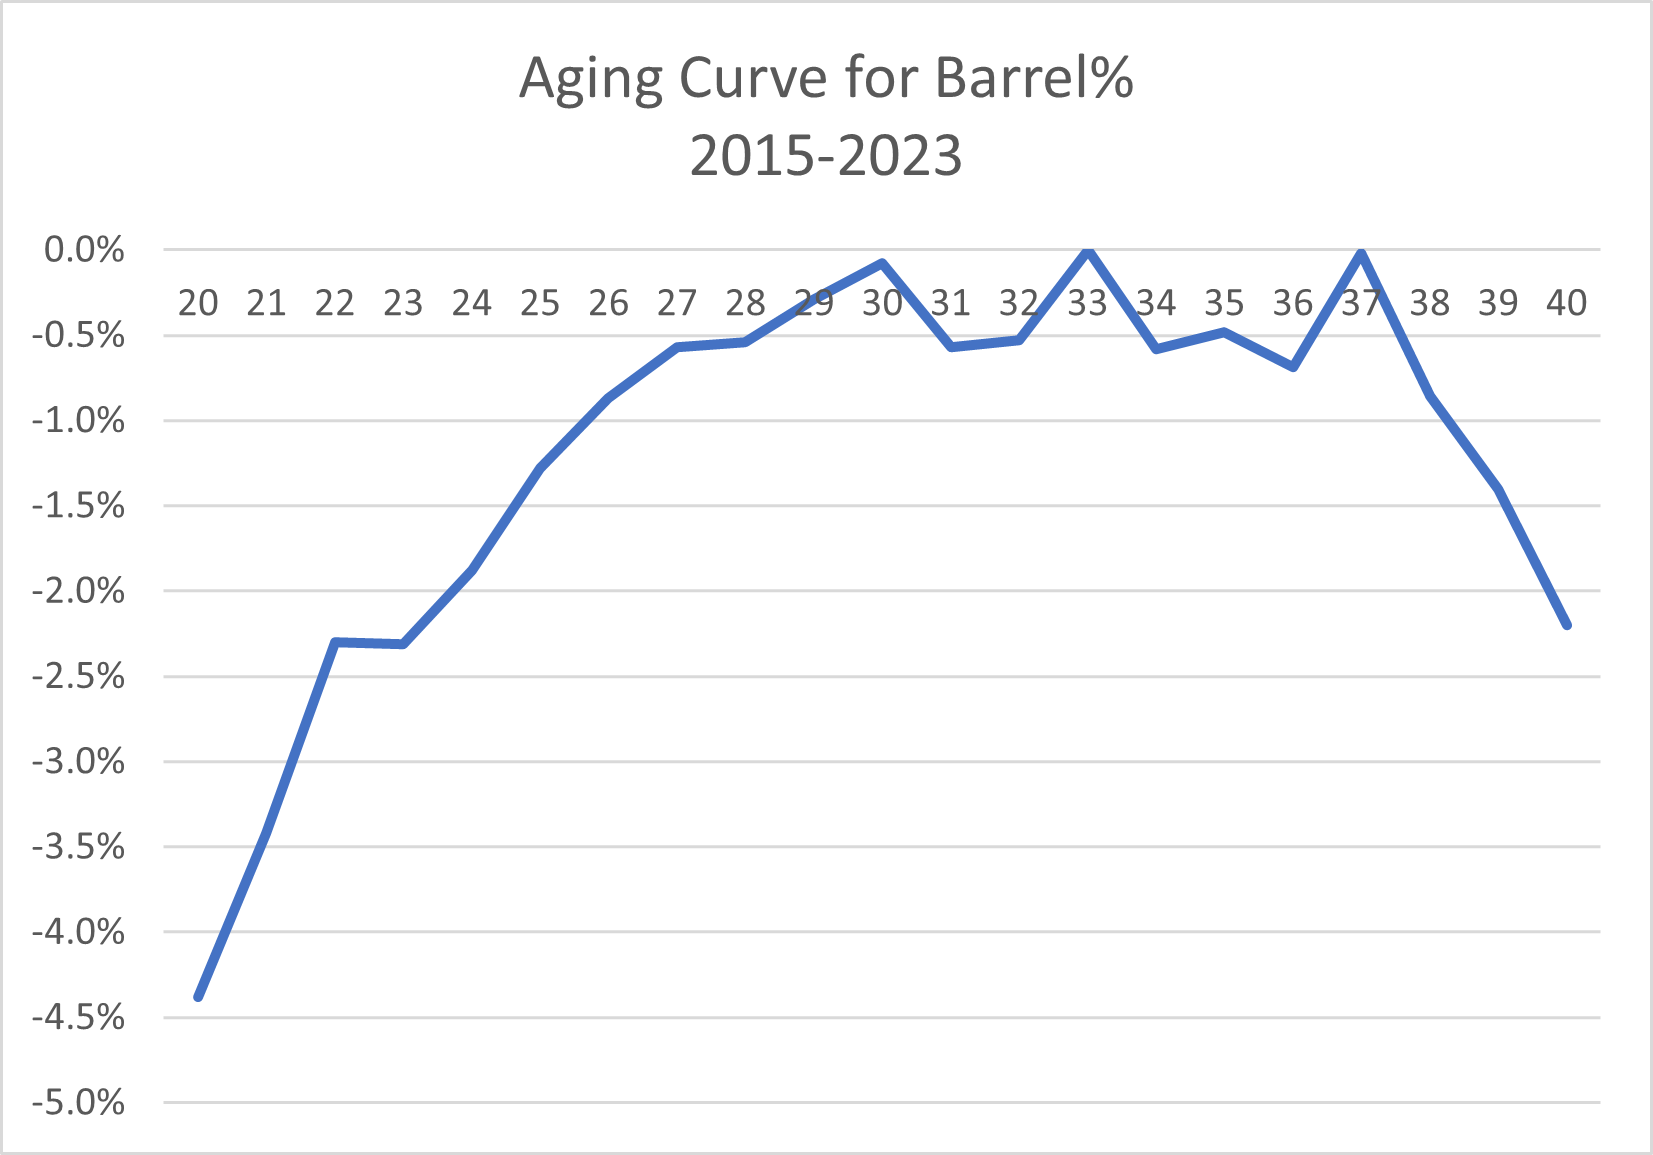
- Barrel Rate (Barrel%)
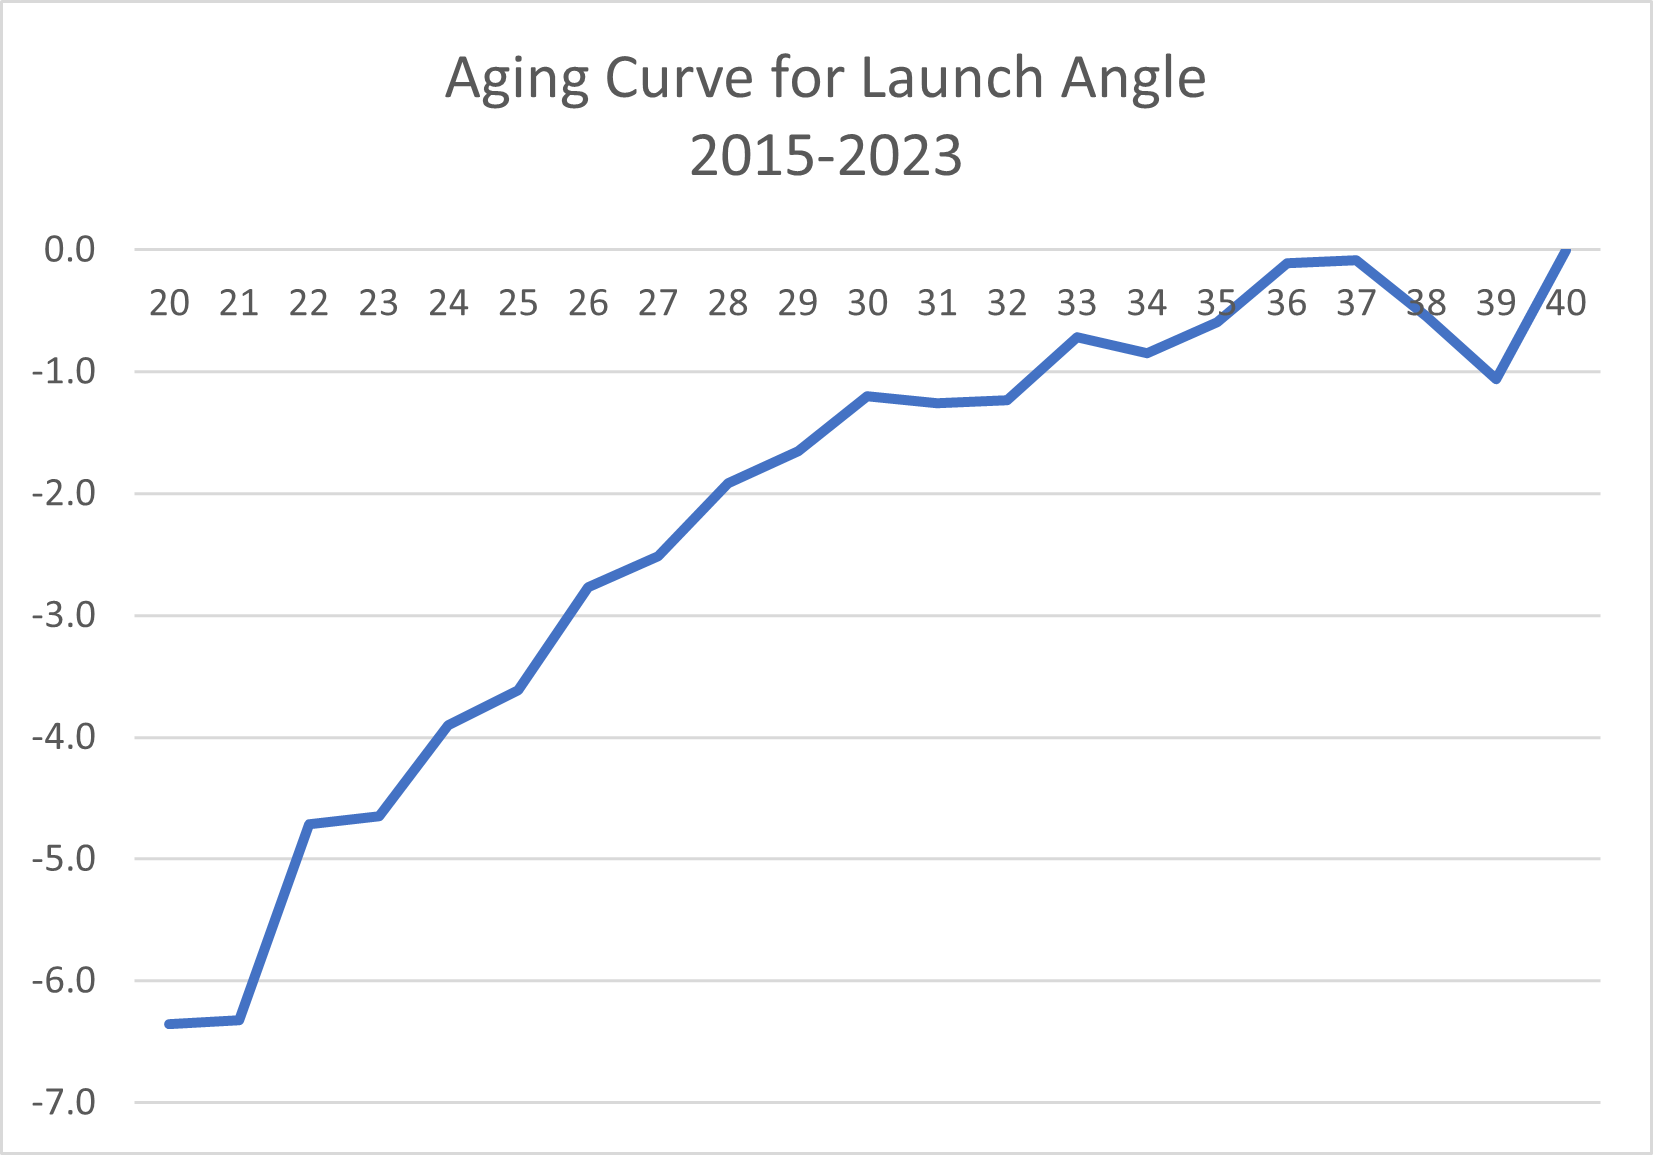
- Launch Angle (LA)
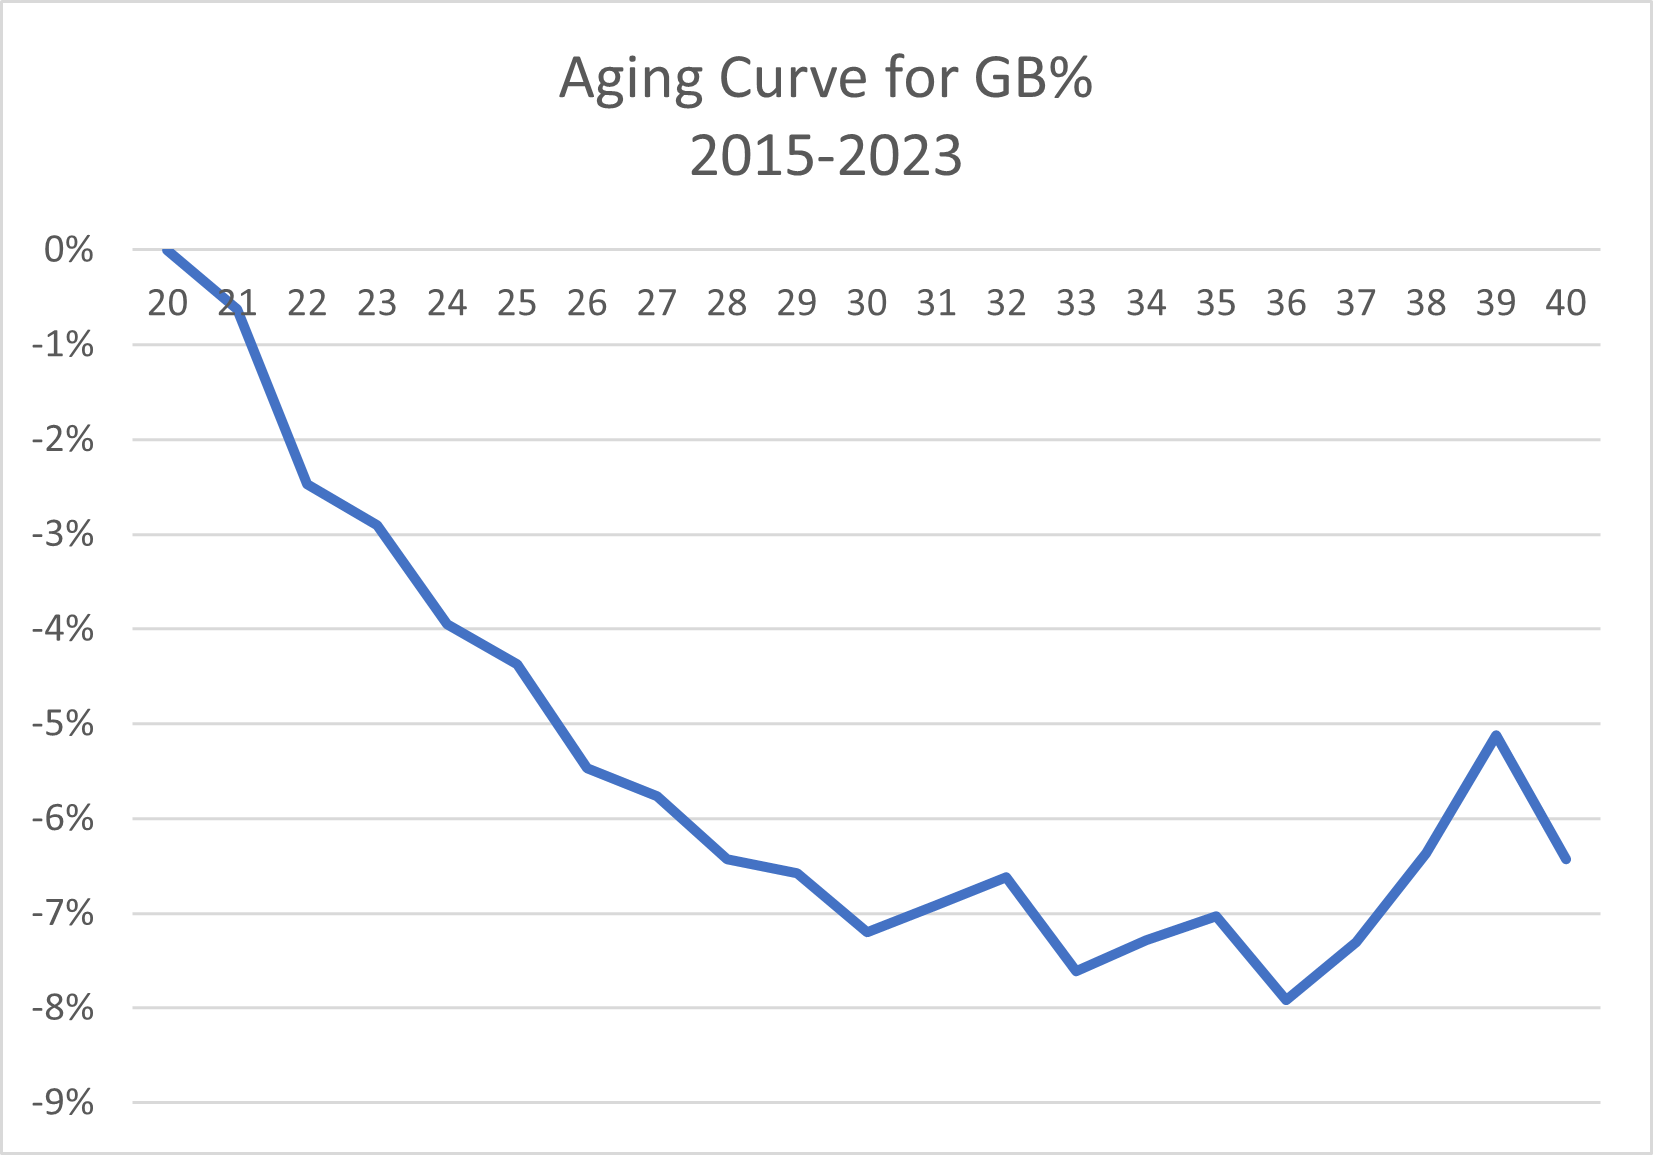
- Groundball Rate (GB%)
To create the new curves, I used the delta method by weighting plate appearances by the harmonic mean. This method has a small survivor bias summarized at the Hardball Times.
… survivor bias, an inherent defect in the delta method, which is that the pool of players who see the light of day at the end of a season (and live to play another day the following year) tend to have gotten lucky in Year 1 and will see a “false” drop in Year 2 even if their true talent were to remain the same. This survivor bias will tend to push down the overall peak age and magnify the decrease in performance (or mitigate the increase) at all age intervals.
Thoughts on the graphs.
- Groundball Rate and Launch Angle change in one direction and don’t have much of a curve to them except in the mid-to-late-30s.
- The effects of hitters losing speed can be seen in the decline of ISO a year or two before xISO.
- The Savant-based power metrics peak from age 27 to 30.
- It’s interesting to see Barrel% flatten as hitters lose raw power but keep raising their launch angle. Once the Barrel% starts to drop, it happens fast.
While the curves have the average improvement, the following table contains the chances of reaching a threshold. For example, a 25-year-old has a 28% chance of increasing his maxEV by 2 mph in his age-26 season.
| ISO | xISO | HH% | AvgEV | MaxEV | Barrel% | LA | GB% | |||
|---|---|---|---|---|---|---|---|---|---|---|
| Age Y1 | Age Y2 | .020 | .020 | 5% | 2 mph | 2 mph | 2% | 5 deg | -5% | Sample Size |
| 21 | 22 | 45% | 61% | 30% | 20% | 44% | 15% | 27% | 19% | 64 |
| 22 | 23 | 36% | 52% | 40% | 27% | 32% | 34% | 18% | 31% | 151 |
| 23 | 24 | 45% | 56% | 30% | 24% | 31% | 33% | 21% | 20% | 251 |
| 24 | 25 | 37% | 48% | 27% | 21% | 25% | 32% | 14% | 26% | 389 |
| 25 | 26 | 40% | 52% | 29% | 21% | 28% | 30% | 15% | 23% | 452 |
| 26 | 27 | 35% | 49% | 25% | 19% | 24% | 32% | 16% | 21% | 468 |
| 27 | 28 | 32% | 42% | 29% | 20% | 19% | 29% | 15% | 20% | 438 |
| 28 | 29 | 33% | 48% | 22% | 16% | 20% | 24% | 15% | 22% | 362 |
| 29 | 30 | 34% | 47% | 26% | 17% | 19% | 28% | 12% | 20% | 312 |
| 30 | 31 | 26% | 38% | 18% | 13% | 18% | 24% | 10% | 24% | 273 |
| 31 | 32 | 30% | 43% | 21% | 16% | 11% | 20% | 13% | 24% | 246 |
| 32 | 33 | 32% | 55% | 20% | 16% | 18% | 24% | 16% | 18% | 200 |
| 33 | 34 | 22% | 34% | 18% | 12% | 8% | 25% | 11% | 24% | 140 |
| 34 | 35 | 24% | 37% | 27% | 17% | 20% | 21% | 9% | 23% | 95 |
| 35 | 36 | 33% | 47% | 17% | 10% | 10% | 24% | 10% | 18% | 60 |
The key takeaway for me is that, on average, it’s tough to show a significant power improvement after a batter’s age-24 season. While the curves head up after that age, it is in small increments.
Finally, I wanted to do one specific study on a specific group of hitters, those who hit the ball into the ground, the Vlad’s/Yandy’s/Yelich’s of the world. I grouped the hitters with a 0 to 10-degree launch angle by age and found the chances of a batter increasing their Launch Angle by 10, 15, and 20 degrees.
| Age Y1 | Age Y2 | Over 10 deg | Over 15 deg | Over 20 deg | Count |
|---|---|---|---|---|---|
| 21 | 22 | 46% | 18% | 4% | 28 |
| 22 | 23 | 38% | 12% | 2% | 60 |
| 23 | 24 | 45% | 10% | 2% | 98 |
| 24 | 25 | 35% | 10% | 4% | 125 |
| 25 | 26 | 39% | 8% | 4% | 157 |
| 26 | 27 | 40% | 13% | 7% | 149 |
| 27 | 28 | 45% | 9% | 5% | 143 |
| 28 | 29 | 40% | 8% | 3% | 97 |
| 29 | 30 | 26% | 10% | 3% | 91 |
| 30 | 31 | 36% | 5% | 1% | 75 |
| 31 | 32 | 39% | 12% | 5% | 66 |
| 32 | 33 | 40% | 5% | 0% | 63 |
| 33 | 34 | 20% | 7% | 0% | 30 |
| 34 | 35 | 50% | 4% | 0% | 26 |
| 35 | 36 | 33% | 7% | 0% | 15 |
While a 10-degree improvement is possible, the chances of anything more drop off after that point.
That’s it for today but I know it is quite a bit of info to take in. I’m sure other scenarios exist that I haven’t thought of yet. Let me know in the comments of any that you would like to see.
Jeff, one of the authors of the fantasy baseball guide,The Process, writes for RotoGraphs, The Hardball Times, Rotowire, Baseball America, and BaseballHQ. He has been nominated for two SABR Analytics Research Award for Contemporary Analysis and won it in 2013 in tandem with Bill Petti. He has won four FSWA Awards including on for his Mining the News series. He's won Tout Wars three times, LABR twice, and got his first NFBC Main Event win in 2021. Follow him on Twitter @jeffwzimmerman.
What does this look like for 95th percentile EV?
I need to wait for the info to come available