Poll 2025: Which Group of Pitchers Performs Better? A Review
During the All-Star break, I polled you fine readers about starting pitchers and your expectations in the second half. Specifically, the poll pitted the 10 greatest SIERA overperformers against the 10 most significant underperformers. I asked you which group would post a lower second half ERA and which range each group’s ERA would fall into. Let’s now review what happened.
As a reminder, below are the aggregate averages of the two groups through the pre-All-Star break period. Remember that you were voting solely on 2nd half ERA. Group A was composed of the SIERA overperformers and B, the underperformers.
| Group | LD% | GB% | FB% | IFFB% | HR/FB | BABIP | LOB% | K% | BB% | ERA | SIERA | Diff |
|---|---|---|---|---|---|---|---|---|---|---|---|---|
| A | 17.8% | 40.5% | 41.7% | 11.0% | 8.5% | 0.253 | 82.2% | 19.6% | 8.3% | 2.62 | 4.43 | -1.81 |
| B | 21.9% | 41.1% | 37.0% | 7.9% | 14.5% | 0.331 | 65.3% | 20.3% | 8.0% | 5.95 | 4.25 | 1.70 |
| League Average* | 19.9% | 41.3% | 38.8% | 9.8% | 12.0% | 0.288 | 73.5% | 21.6% | 7.9% | 4.11 | 4.11 | 0.00 |
The poll results were as follows:
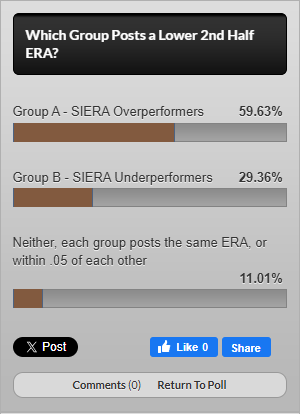
So despite Group A and B posting similar skills in the first half, nearly 60% of you still believed that Group A, the SIERA overperformers, would hold onto enough of their magic to continue to outperform B over the second half. Just over 29% of you thought the pendulum was bound to swing in the opposite direction during the second half, resulting in a better ERA for the underperformers, matching with the group’s slightly higher strikeout rate and lower walk rate. About 11% of you thought it was a complete tossup, believing the two groups would finish within .05 points of ERA over the second half, owing to the similarity in skills.
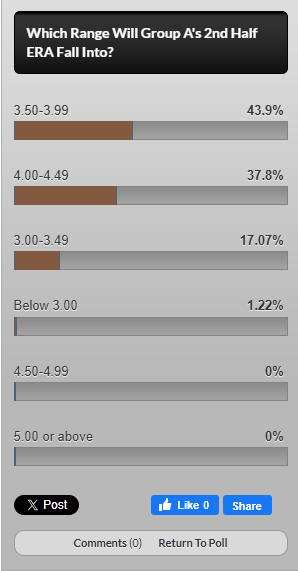
When forecasting Group A’s ERA over the second half, nearly 44% of you believed they would not regress all the way back to their SIERA in the mid-4.00 range. Either their underlying skills would improve to deliver a legitimate mid-to-high 3.00 ERA, or this group truly owns luck trio skills that will keep their ERAs well below their SIERA marks. Nearly as many of you, about 38%, though there would be more regression in the second half, with the group’s ERA jumping right up to their SIERA. They don’t call them the luck trio for nothing!
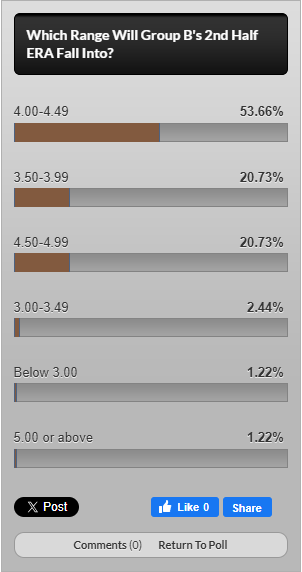
Moving on to Group B, the majority at nearly 54% believed they would endure much better fate in the second half, as their ERA improves into the range of their first half SIERA. It’s interesting that readers therefore believed this group’s bad luck was just that, bad luck, but a significant portion of readers believed that Group A’s apparent good luck wasn’t actually luck at all, but rather a healthy amount of skill leading to the SIERA overperformance. That’s not exactly a consistent belief.
Also interesting is that nearly 21% of you voted that Group B’s ERA would fall into the 3.50-3.99 range in the second half, which is even better than their first half SIERA! The only explanation here is the Gambler’s Fallacy that because Group B underperformed their SIERA so dramatically in the first half, they were due for the opposite luck in the second half by overperforming their skills to bring their overall season ERA in line with their SIERA. I used to believe this would happen and often times it does, but it’s still a fallacy and never something to bet on.
Now on to the second half results:
| Name | LD% | GB% | FB% | IFFB% | HR/FB | BABIP | LOB% | K% | BB% | ERA | SIERA | Diff |
|---|---|---|---|---|---|---|---|---|---|---|---|---|
| Kodai Senga | 19.3% | 45.0% | 35.8% | 7.7% | 20.5% | 0.298 | 65.6% | 20.5% | 12.9% | 6.56 | 4.98 | 1.58 |
| Tyler Mahle | 19.2% | 23.1% | 57.7% | 0.0% | 6.7% | 0.320 | 100.0% | 26.3% | 5.3% | 0.93 | 3.86 | -2.93 |
| Randy Vásquez | 14.8% | 44.3% | 41.0% | 8.0% | 8.0% | 0.294 | 69.3% | 17.7% | 3.8% | 3.92 | 4.20 | -0.27 |
| Andrew Abbott | 20.1% | 33.0% | 46.9% | 18.1% | 8.6% | 0.292 | 73.7% | 21.0% | 6.0% | 3.84 | 4.25 | -0.41 |
| Noah Cameron | 26.3% | 37.9% | 35.9% | 9.9% | 15.5% | 0.263 | 81.9% | 19.9% | 7.5% | 3.69 | 4.38 | -0.70 |
| Jose Quintana | 17.0% | 41.0% | 42.0% | 12.7% | 13.9% | 0.242 | 68.2% | 16.2% | 7.5% | 4.77 | 4.88 | -0.10 |
| Ranger Suárez | 20.5% | 43.2% | 36.4% | 8.8% | 10.0% | 0.364 | 74.4% | 22.9% | 5.0% | 4.40 | 3.73 | 0.67 |
| Seth Lugo | 20.0% | 39.3% | 40.7% | 10.2% | 20.3% | 0.321 | 67.5% | 17.6% | 11.4% | 7.51 | 5.20 | 2.32 |
| Matthew Boyd | 15.2% | 39.4% | 45.5% | 11.1% | 10.0% | 0.273 | 69.1% | 18.7% | 6.8% | 4.63 | 4.53 | 0.10 |
| Bailey Falter | 24.7% | 30.3% | 44.9% | 12.5% | 12.5% | 0.321 | 62.2% | 17.9% | 9.8% | 6.75 | 5.03 | 1.72 |
| Group Average | 19.7% | 39.0% | 41.3% | 11.3% | 12.4% | 0.296 | 71.7% | 19.6% | 7.5% | 4.75 | 4.47 | 0.28 |
| League Average* | 19.9% | 41.6% | 38.5% | 9.7% | 12.5% | 0.289 | 71.8% | 22.6% | 8.3% | 4.28 | 4.00 | 0.28 |
| Name | LD% | GB% | FB% | IFFB% | HR/FB | BABIP | LOB% | K% | BB% | ERA | SIERA | Diff |
|---|---|---|---|---|---|---|---|---|---|---|---|---|
| Sandy Alcantara | 19.8% | 48.1% | 32.1% | 7.9% | 13.2% | 0.250 | 75.6% | 21.3% | 6.0% | 3.33 | 3.90 | -0.57 |
| Ben Brown | 24.7% | 44.2% | 31.2% | 12.5% | 20.8% | 0.301 | 56.0% | 26.5% | 4.4% | 5.33 | 2.91 | 2.43 |
| Eduardo Rodriguez | 20.9% | 40.0% | 39.1% | 11.1% | 10.0% | 0.284 | 77.7% | 16.7% | 9.7% | 4.01 | 5.08 | -1.07 |
| Trevor Williams | ||||||||||||
| Bryce Elder | 19.8% | 45.3% | 34.9% | 3.7% | 9.9% | 0.294 | 63.1% | 19.2% | 7.1% | 4.93 | 4.35 | 0.58 |
| Antonio Senzatela | 23.1% | 39.6% | 37.3% | 6.0% | 12.0% | 0.354 | 66.6% | 13.5% | 7.9% | 6.75 | 5.07 | 1.68 |
| Dylan Cease | 20.0% | 38.7% | 41.3% | 15.6% | 9.4% | 0.318 | 70.4% | 31.0% | 11.6% | 4.04 | 3.66 | 0.38 |
| Walker Buehler | 23.0% | 40.1% | 36.8% | 12.5% | 8.9% | 0.259 | 84.6% | 13.8% | 12.4% | 3.00 | 5.75 | -2.75 |
| Cal Quantrill | 19.5% | 32.8% | 47.7% | 6.6% | 16.4% | 0.264 | 65.0% | 11.2% | 6.8% | 7.00 | 5.69 | 1.31 |
| Zac Gallen | 16.7% | 46.9% | 36.4% | 4.8% | 12.0% | 0.241 | 70.4% | 20.5% | 6.6% | 3.97 | 4.13 | -0.16 |
| Group Average | 20.3% | 42.5% | 37.2% | 8.5% | 11.8% | 0.280 | 71.3% | 19.6% | 8.2% | 4.42 | 4.46 | -0.05 |
| League Average* | 19.9% | 41.6% | 38.5% | 9.7% | 12.5% | 0.289 | 71.8% | 22.6% | 8.3% | 4.28 | 4.00 | 0.28 |
| Group | LD% | GB% | FB% | IFFB% | HR/FB | BABIP | LOB% | K% | BB% | ERA | SIERA | Diff |
|---|---|---|---|---|---|---|---|---|---|---|---|---|
| A | 19.7% | 39.0% | 41.3% | 11.3% | 12.4% | 0.296 | 71.7% | 19.6% | 7.5% | 4.75 | 4.47 | 0.28 |
| B | 20.3% | 42.5% | 37.2% | 8.5% | 11.8% | 0.280 | 71.3% | 19.6% | 8.2% | 4.42 | 4.46 | -0.05 |
| League Average* | 19.9% | 41.6% | 38.5% | 9.7% | 12.5% | 0.289 | 71.8% | 22.6% | 8.3% | 4.28 | 4.00 | 0.28 |
Let’s start with the answers to the poll questions. Group A’s ERA skyrocketed from 2.62 in the first half (versus a 4.43 SIERA) to 4.75! Amazingly, their SIERA marks were almost identical, so this wasn’t simply a case of the pitchers pitching worse. Instead, their magical BABIP suppression skills completely disappeared, while both their HR/FB rate and LOB% marks jumped back up to league average. It’s funny to see the pendulum did in fact swing the other way, as they suddenly underperformed their SIERA by a marginal degree this time.
On the other hand, Group B’s ERA dropped from an inflated 5.95 to 4.42. Their SIERA rose a bit from the first to the second half, but that second half ERA finished almost exactly at their SIERA mark. Luck was no longer involved with their results!
So this time, Group B’s ERA actually finished lower than Group A by a meaningful 0.33 points of ERA! I love when that happens, though this hasn’t been the case every year.
Returning to the poll results with answers in hand, we now know that 29.36% were correct when voting on Group B posting a lower second half ERA. None of you voted that Group A’s ERA would fall into the 4.50-4.99 range, which goes to show how surprising this result was. The majority did get Group B’s second half ERA range correct at 4.00-4.49, though.
Now let’s talk some specific pitchers, beginning with the overperformers. Kodai Senga was the poster boy for a good fortune-filled first half and it was easy for everyone to just wave their hand and respond with, “yeah, but ghost fork”! Because of his signature pitch, it seemed that the rules simply wouldn’t apply to him and he would avoid regression due to the dominance of that pitch. Oops! Every time people search for an explanation to describe good luck, assume it’s wrong, there is no explanation, and regression will occur. The icing on the cake here was that Senga’s second half regression got so bad, he was sent to the minors in early September and never returned. It’ll be interesting to see how he’s valued next year given the massive roller coaster ride he took his owners on this season.
Injury limited Tyler Mahle to just two second half starts this year, so there simply wasn’t enough time for regression to potentially rear its head. He was one of the luckiest pitchers in baseball this year, which could lead to some overvaluation in deep leagues next year.
Andrew Abbott did improve his control, but the quality of his stuff remains at or below average, and although he remained useful in most formats in the second half, he was obviously nowhere near as valuable. I’m curious if this was enough of a fall to keep his 2026 perceived value from inflating too much, or if he’ll still be overvalued.
I thought of Noah Cameron as a deep sleeper after word that his Spring Training velocity had jumped. Naturally, his velocity ended up being just about the same as last year, but he broke out anyway thanks to a massive heaping of good luck. Like Abbott, he lost a lot of luster in the second half, but still posted a sub-4.00 ERA and continued to deliver fantasy value. With a low strikeout rate, and below average stuff, I would be shocked if he wasn’t overvalued next season.
The bubble finally burst on Seth Lugo’s results, as his good fortune reversed in the second half before he hit the IL. At age 36 next year and a declining strikeout rate, I’m likely out in every format, even AL-only unless I can get him for a buck.
So much for the Matthew Boyd breakout year. A low strikeout rate suggested this wasn’t really a breakout though, and that strikeout rate plunged in the second half. Combine that with a reversal in LOB% and you have the recipe for a poor second half. With increased velocity, I’m surprised his strikeout rate wasn’t meaningfully higher.
Let’s now talk about the underperformers. Holy Sandy Alcantara! You want a 2026 sleeper? This is your guy. He was so bad in the first half that his ERA remained high and it overshadowed how strongly he rebounded in the second half. He regained his control, his strikeout rate jumped back above 20%, and he was finally stranding runners! I wonder how many websites are going to point to this second half and name him a top sleeper. I bet his cost will suggest he’s no longer a sleeper at some point, so with the underwhelming strikeout rate, he could quickly become an unattractive draft target.
How did Dylan Cease still post an ERA over 4.00 in the second half! A high BABIP once again, and his control really left him, as he posted a double digit walk rate. Seriously, I’m going to pretend this season never happened and I’ll be really disappointed if he doesn’t end up on my two mixed league teams next year.
Wow, how did Walker Buehler manage to post a 3.00 ERA with such awful skills in the second half?! Don’t be fooled — he remains a shell of his former self. Maybe a full offseason will help him regain his stuff and skills.
Was there ever a more Jekyll and Hyde pitcher this year than Zac Gallen?! He allowed at least five runs in a start a whopping 10 times, while also making four starts going at least six innings and not allowing a run, plus another seven starts with only one run allowed. That’s crazy! His luck was much improved in the second half, though his strikeout rate remained well down from last year. Despite him clearly deserving a lower ERA, I don’t like this version of Gallen with just a league averageish strikeout rate.
Mike Podhorzer is the founder of ProjectingX IQ, an advanced fantasy baseball analytics platform that transforms projection data and in-season performance signals into actionable intelligence. He is the 2015 Fantasy Sports Writers Association Baseball Writer of the Year and three-time Tout Wars champion. He is the author of the eBook Projecting X 2.0: How to Forecast Baseball Player Performance, which teaches you how to project players yourself. Follow Mike on X@MikePodhorzer and contact him via email.