Poll 2025: Which Group of Hitters Performs Better? A Review
During the All-Star break, I polled you fine readers about hitters and your expectations in the second half. Specifically, the poll pitted the 10 greatest xwOBA overperformers against the 10 most significant underperformers. I asked you which group would post a higher second half wOBA and which range each group’s wOBA would fall into. Let’s now review what happened.
As a reminder, below are the aggregate averages of the two groups through the pre-All-Star break period. Remember that you were voting solely on 2nd half wOBA. Group A was composed of the xwOBA overperformers and B, the underperformers.
| Group | BA | xBA | SLG | xSLG | wOBA | xwOBA | Diff |
|---|---|---|---|---|---|---|---|
| A | 0.272 | 0.249 | 0.475 | 0.408 | 0.355 | 0.321 | 0.033 |
| B | 0.231 | 0.279 | 0.406 | 0.507 | 0.308 | 0.366 | -0.058 |
| League Average | 0.245 | 0.252 | 0.400 | 0.422 | 0.313 | 0.325 | -0.012 |
The poll results were as follows:
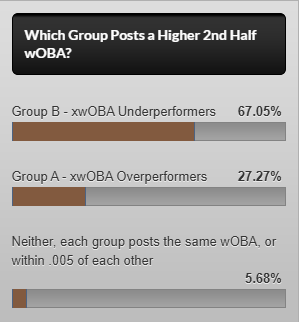
The vast majority of you, about two-thirds, voted that Group B, the xwOBA underperformers, would post a higher second half wOBA. That is completely opposite from the pitcher SIERA poll where nearly 60% of you voted that the SIERA overperformers would continue to post a lower second half ERA. So we could infer that you believe that xwOBA better captures a hitter’s skill than SIERA captures a pitcher’s skill, and some of what SIERA might perceive as good or bad luck is actually not.
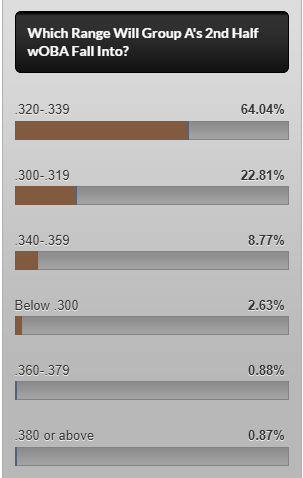
Similar to the overall vote for higher wOBA, just under two-thirds of you voted that Group A’s second half wOBA would fall into the .320-.339 range, which matches up with the .321 xwOBA mark they posted (versus a .355 actual mark). Nearly 23% thought regression would really take its tolls, overcorrecting in the second half to bring down the hitters’ full season wOBA more in line with their first half xwOBA.
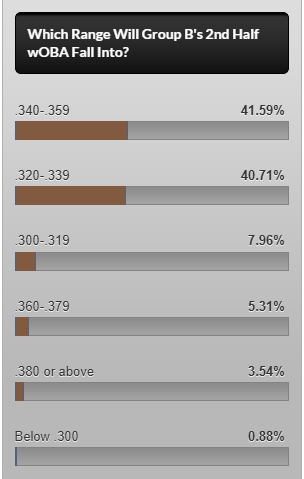
There was much less agreement about Group B’s second half wOBA. The leading vote getter was the .340-.359 wOBA range, which was just below the .336 xwOBA mark the group posted in the first half (versus a .308 actual mark). But nearly the same percentage of you voted for the lower .320-.339 range, believing the group would fall right in between their first half wOBA and xwOBA in the second half. Perhaps xwOBA is failing to account for some skills, or lack thereof, that should have reduced the group’s xwOBA?
Now on to the second half results:
| Player | BA | xBA | SLG | xSLG | wOBA | xwOBA | Diff |
|---|---|---|---|---|---|---|---|
| Jacob Wilson윌슨 | 0.267 | 0.269 | 0.411 | 0.367 | 0.316 | 0.301 | 0.015 |
| Zach McKinstry | 0.213 | 0.228 | 0.378 | 0.328 | 0.286 | 0.280 | 0.005 |
| Jose Altuve | 0.247 | 0.239 | 0.407 | 0.383 | 0.315 | 0.302 | 0.013 |
| TJ Friedl | 0.238 | 0.218 | 0.335 | 0.308 | 0.318 | 0.301 | 0.016 |
| Cal Raleigh | 0.229 | 0.247 | 0.526 | 0.566 | 0.361 | 0.382 | -0.020 |
| Isaac Paredes | 0.219 | 0.200 | 0.344 | 0.314 | 0.280 | 0.261 | 0.019 |
| Hunter Goodman | 0.279 | 0.253 | 0.525 | 0.485 | 0.359 | 0.333 | 0.027 |
| Spencer Steer | 0.215 | 0.211 | 0.419 | 0.414 | 0.324 | 0.325 | -0.002 |
| Wilmer Flores | 0.231 | 0.244 | 0.389 | 0.386 | 0.282 | 0.296 | -0.013 |
| Eugenio Suárez | 0.196 | 0.192 | 0.463 | 0.417 | 0.309 | 0.292 | 0.018 |
| Group Average | 0.236 | 0.232 | 0.429 | 0.407 | 0.321 | 0.313 | 0.008 |
| League Average | 0.245 | 0.251 | 0.409 | 0.420 | 0.315 | 0.323 | -0.008 |
| Player | BA | xBA | SLG | xSLG | wOBA | xwOBA | Diff |
|---|---|---|---|---|---|---|---|
| Juan Soto | 0.266 | 0.277 | 0.549 | 0.598 | 0.398 | 0.420 | -0.022 |
| Bryan Reynolds | 0.276 | 0.272 | 0.453 | 0.432 | 0.357 | 0.348 | 0.009 |
| Ben Rice | 0.281 | 0.305 | 0.542 | 0.602 | 0.380 | 0.414 | -0.034 |
| Luis García Jr. | 0.241 | 0.268 | 0.439 | 0.474 | 0.299 | 0.328 | -0.028 |
| Michael Conforto | 0.223 | 0.251 | 0.350 | 0.438 | 0.297 | 0.342 | -0.045 |
| Salvador Perez | 0.225 | 0.270 | 0.483 | 0.564 | 0.323 | 0.372 | -0.049 |
| Jo Adell | 0.226 | 0.252 | 0.487 | 0.542 | 0.317 | 0.349 | -0.032 |
| Brenton Doyle | 0.287 | 0.259 | 0.467 | 0.431 | 0.333 | 0.309 | 0.024 |
| Michael Harris II | 0.299 | 0.306 | 0.530 | 0.535 | 0.358 | 0.369 | -0.011 |
| Mike Trout | 0.226 | 0.208 | 0.401 | 0.407 | 0.331 | 0.328 | 0.004 |
| Group Average | 0.258 | 0.271 | 0.479 | 0.512 | 0.342 | 0.361 | -0.019 |
| League Average | 0.245 | 0.251 | 0.409 | 0.420 | 0.315 | 0.323 | -0.008 |
| Group | BA | xBA | SLG | xSLG | wOBA | xwOBA | Diff |
|---|---|---|---|---|---|---|---|
| A | 0.236 | 0.232 | 0.429 | 0.407 | 0.321 | 0.313 | 0.008 |
| B | 0.258 | 0.271 | 0.479 | 0.512 | 0.342 | 0.361 | -0.019 |
| League Average | 0.245 | 0.251 | 0.409 | 0.420 | 0.315 | 0.323 | -0.008 |
Let’s start with the answers to the poll questions. As voted on by two-thirds of you, Group B did indeed post a higher wOBA during the second half, recording a .342 mark, versus a .321 mark for Group A. What’s interesting here is that Group A overperformed again, but by a significantly smaller degree than in the first half, while Group B also underperformed again, by a larger degree than Group A’s overperformance, but still a smaller degree than in the first half. Perhaps park factors played a role and/or other skills not being captured by the equation, like horizontal batted ball direction.
Moving on to Group A’s wOBA range, they finished right at the bottom of that .320-.339 range that nearly two-thirds of you voted for. What’s incredible is that .321 second half wOBA perfectly matches the group’s first half xwOBA! Though I didn’t include BABIP in the tables, it’s pretty clear looking at batting average versus xBA that the group lucked out on balls in play falling for hits in the first half, and that luck almost entirely disappeared in the second half.
Group B also finished at the bottom of the top vote getting range of .340-.359 with their .342 mark. That mark was still well below their .366 first half xwOBA, but of course significantly higher than their .308 actual wOBA. Looking at batting average versus xBA again, they clearly suffered from some terrible BABIP fortune in the first half. There was still a meaningful gap in the second half, but it certainly narrowed.
Now let’s discuss specific players in each of the groups. Jacob Wilson was one of the first half’s biggest surprises. However, Statcast thought the breakout was all smoke and mirrors. Sure enough, his performance suffered in the second half, and while he overperformed his xwOBA once again, the gap was much smaller. He also battled injury which could have played a role, plus he only accrued 157 PAs, so the sample size was small.
Jose Altuve has made a career out of overperforming his xwOBA, as he has done so every single season the stat has been calculated, excluding the short 2020 season when he finished just short. So it was no surprise to find him third on the overperformers list in the first half. Amazingly in the second half, his wOBA actually fell to just above his first half xwOBA, so perhaps he’s finally feeling the effects of aging. The full season skills still look pretty stable though, but his stolen base pace fell off, giving him less fantasy upside. He’ll be 36 years old for most of next season, so he’s going to be an age-related decline risk.
Sheesh, it sure didn’t feel like Cal Raleigh had such an inferior second half! Now mind you, although he overperformed his xwOBA over the first half, his xwOBA was still .385, which would have been a major breakout to begin with. He didn’t need the overperformance to enjoy an MVP level performance. His xwOBA was actually quite consistent in each half, but he ended up underperforming a bit in the second half. I’m excited to see how much fantasy owners pay for him next year, as nothing in his underlying skills scream fluke, though it would be surprising if he stole double digit bases again. That said, I would be shocked if I rostered him, as buying a catcher after a historic season is probably never a profitable decision.
You probably didn’t realize it because he continued to hit bombs, but Eugenio Suárez wasn’t a very good hitter in the second half. He actually batted just below the Mendoza Line (.200), but did continue to contribute in the non-stolen base categories. It helped that he posted the highest FB% of his career, along with a return to the 20%+ HR/FB rate level.
Remember when Juan Soto endured a seemingly ho-hum first half? Actually, it was more like a ho-hum first two months, as he was superhuman in June to pick up his season line. Still, he underperformed his xwOBA by the largest margin of any hitter, even while posting a .386 actual wOBA! In the second half, his wOBA did rise, but his xwOBA fell a bit and he still underperformed. Incredibly, he has underperformed every single season since 2021. What’s Soto doing or not doing that xwOBA is failing to capture?! Anyway, the 38 steals was an absolute shocker. I have no idea how many he should be forecasted for next season, but the performance should push his ADP back into the top five and he may actually earn a profit if he steals 30+ again.
Gosh, I held onto Bryan Reynolds, and started him, all season long in my 12-team mixed league. He’s just one of the many reasons I ended up near the basement in my local league I’ve been running for over 20 years! I didn’t even realize he rebounded so strongly in the second half, posting a wOBA slightly higher than his second half xwOBA. He still only hit six home runs though and didn’t even attempt a steal. So he was still useless in fantasy leagues despite the stronger actual baseball performance. I’m sure he’ll rebound at least somewhat next year, but he doesn’t make for a great target in a shallow format given the weak home park for home runs and the poor lineup around him capping his runs scored and RBI upside.
Woah, Ben Rice! He underperformed again, but man was he awesome this second half. It’s too bad he hasn’t been able to hit lefties, so a strong side platoon role really cuts into his shallow mixed league value. I think he has a higher HR/FB rate in him.
What a weird pair of halves for Jo Adell. In the first half, he was quite good (for him), but massively underperformed his xwOBA. Then in the second half, he was significantly worse, with both his actual wOBA and xwOBA falling, but he dramatically underperformed again. On the season, it left him with a .333 wOBA, but a .378 xwOBA, and yet he still hit 37 home runs! His season looks pretty legit in my eyes, but he was so poor defensively, any extended slump could lead to some lost playing time, so that’s the risk.
Second half Michael Harris II has returned! This is now the third straight season he’s been significantly better in the second half than the first. But this year, he was really, really bad in the first half. It was bad enough to make you wonder if he’s suddenly just done as a productive Major Leaguer. All of his second half rebound came in July and August, as he was terrible again in September, which might keep his price down a bit next year. It ended up being a pretty solid fantasy season as he went 20/20, though he someone only managed to score 55 runs, which seems impossible given his speed. Though it’s not too surprising given his hatred of the base on balls, which resulted in just a .268 OBP.
Mike Podhorzer is the founder of ProjectingX IQ, an advanced fantasy baseball analytics platform that transforms projection data and in-season performance signals into actionable intelligence. He is the 2015 Fantasy Sports Writers Association Baseball Writer of the Year and three-time Tout Wars champion. He is the author of the eBook Projecting X 2.0: How to Forecast Baseball Player Performance, which teaches you how to project players yourself. Follow Mike on X@MikePodhorzer and contact him via email.
Grabbed Raleigh with 96th pick in a 6×6 league that has obp and slg. I don’t expect him to go that late again and I don’t expect to draft him.
You must have had a good season!
Won the league. Starting pitching worked out well and I drafted Buxton, too. He and Raleigh were back-to-back picks.