Poll 2023: Which Group of Hitters Performs Better? A Review
In addition to my starting pitcher poll comparing 1st and 2nd half SIERA marks, I also polled you fine readers during the all-star break about hitters. The hitter poll pitted the 10 greatest xwOBA overperformers against the 10 most significant underperformers. I asked you which group would post a higher second half wOBA and which range each group’s wOBA would fall into.
As a reminder, below are the aggregate averages of the two groups through the pre-all-star break period. Remember that you were voting solely on 2nd half wOBA. Group A was composed of the xwOBA overperformers and B, the underperformers.
| Group | BA | xBA | SLG | xSLG | wOBA | xwOBA | Diff |
|---|---|---|---|---|---|---|---|
| A | 0.294 | 0.256 | 0.481 | 0.410 | 0.361 | 0.322 | 0.039 |
| B | 0.253 | 0.284 | 0.420 | 0.495 | 0.322 | 0.366 | -0.043 |
| League Average | 0.248 | 0.248 | 0.410 | 0.413 | 0.318 | 0.322 | -0.004 |
The poll results were as follows:
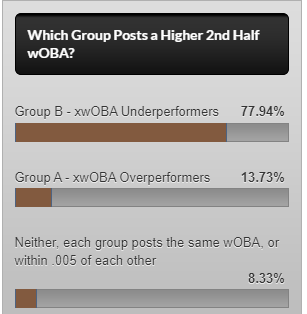

What’s interesting here is that unlike for starting pitchers, the majority of you voted that Group B, the underperformers, would straight up perform better over the second half. So that suggests you feel xwOBA more accurately reflects hitter talent, whereas SIERA fails to account for more factors that influence a pitcher’s results. I think I agree with this, though I was still surprised by the margin of majority for the Group A pitchers in yesterday’s results.
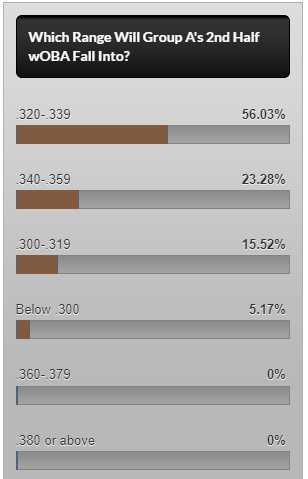
You also weren’t influenced all that much by Group A’s actual first half wOBA, as the majority voted that their second half wOBA would fall into the range in which their first half xwOBA fell into. So essentially, they would showcase similar skills, but their good fortune would disappear. For Group B, the majority felt as though the group would fail to push their second half wOBA mark all the way up to their first half xwOBA, but it still represented a nice rebound.
Now on to the second half results:
| Player | BA | xBA | SLG | xSLG | wOBA | xwOBA | Diff |
|---|---|---|---|---|---|---|---|
| Isaac Paredes | 0.233 | 0.233 | 0.470 | 0.376 | 0.346 | 0.317 | 0.029 |
| Lane Thomas | 0.223 | 0.247 | 0.431 | 0.452 | 0.300 | 0.324 | -0.024 |
| Brandon Marsh | 0.281 | 0.253 | 0.473 | 0.422 | 0.384 | 0.364 | 0.020 |
| Corbin Carroll | 0.280 | 0.278 | 0.455 | 0.428 | 0.350 | 0.346 | 0.004 |
| Joey Meneses | 0.264 | 0.240 | 0.397 | 0.356 | 0.309 | 0.287 | 0.022 |
| Luis Arraez | 0.314 | 0.318 | 0.465 | 0.476 | 0.340 | 0.348 | -0.008 |
| Anthony Santander | 0.239 | 0.230 | 0.439 | 0.408 | 0.318 | 0.307 | 0.011 |
| Thairo Estrada | 0.268 | 0.258 | 0.390 | 0.353 | 0.298 | 0.285 | 0.013 |
| Spencer Steer | 0.265 | 0.255 | 0.447 | 0.398 | 0.343 | 0.325 | 0.018 |
| Nolan Arenado | 0.241 | 0.268 | 0.373 | 0.401 | 0.285 | 0.310 | -0.025 |
| Group Average | 0.261 | 0.259 | 0.433 | 0.408 | 0.325 | 0.320 | 0.005 |
| League Average | 0.249 | 0.245 | 0.419 | 0.407 | 0.320 | 0.318 | 0.002 |
| Player | BA | xBA | SLG | xSLG | wOBA | xwOBA | Diff |
|---|---|---|---|---|---|---|---|
| Keibert Ruiz | 0.300 | 0.263 | 0.467 | 0.377 | 0.347 | 0.300 | 0.047 |
| Vladimir Guerrero Jr. | 0.251 | 0.272 | 0.444 | 0.426 | 0.339 | 0.346 | -0.007 |
| Tim Anderson | 0.274 | 0.251 | 0.338 | 0.337 | 0.293 | 0.283 | 0.010 |
| Bobby Witt Jr. | 0.301 | 0.305 | 0.563 | 0.561 | 0.378 | 0.385 | -0.007 |
| Josh Bell | 0.266 | 0.259 | 0.461 | 0.471 | 0.341 | 0.344 | -0.003 |
| Eugenio Suarez | 0.238 | 0.211 | 0.408 | 0.381 | 0.319 | 0.302 | 0.017 |
| Starling Marte | 0.071 | 0.068 | 0.071 | 0.088 | 0.107 | 0.114 | -0.007 |
| Bryan Reynolds | 0.261 | 0.268 | 0.470 | 0.469 | 0.339 | 0.344 | -0.005 |
| Ronald Acuna Jr. | 0.345 | 0.363 | 0.613 | 0.671 | 0.439 | 0.471 | -0.032 |
| Pete Alonso | 0.223 | 0.234 | 0.511 | 0.520 | 0.347 | 0.362 | -0.015 |
| Group Average | 0.276 | 0.273 | 0.482 | 0.477 | 0.353 | 0.353 | -0.001 |
| League Average | 0.249 | 0.245 | 0.419 | 0.407 | 0.320 | 0.318 | 0.002 |
| Group | BA | xBA | SLG | xSLG | wOBA | xwOBA | Diff |
|---|---|---|---|---|---|---|---|
| A | 0.261 | 0.259 | 0.433 | 0.408 | 0.325 | 0.320 | 0.005 |
| B | 0.276 | 0.273 | 0.482 | 0.477 | 0.353 | 0.353 | -0.001 |
| League Average | 0.249 | 0.245 | 0.419 | 0.407 | 0.320 | 0.318 | 0.002 |
Let’s start with the answers to the poll questions. Group A’s xwOBA fell to just above their first half xwOBA. While xwOBA is not meant to be predictive, it sure did a good job predicting future performance for this group! As a result, they posted a meaningfully lower second half wOBA than Group B, who enjoyed a nice rebound, though fell short of their first half xwOBA. Also note how close the two groups finished to their aggregate xwOBA this time. Sure, Group A overperformed again, but just barely this time, while Group B finished right on the dot. Group A’s wOBA finished in the range most voted, while Group B’s did as well. The voters went three for three!
Now let’s talk some specific players. The first half’s biggest xwOBA overperformer was the Rays’ Isaac Paredes. He did regress a bit in the second half, while barely improving his skills, but still handily overperformed, just by a lesser degree. You can see in his SLG vs xSLG that his overperformance was driven by significantly better power results than his xwOBA calculates he was deserving of. With just a 107.7 maxEV and 5.9% Barrel%, it’s a miracle he managed a 16.9% HR/FB rate and .238 ISO. He’s an easy power regression candidate next year.
Brandon Marsh grew into his wOBA by massively improving his skills and becoming a legitimately good hitter in the second half. He still overperformed, but at least he was good this time. Corbin Carroll’s performance dropped right back to his xwOBA, but I don’t think his fantasy owners cared. He was an absolute fantasy monster this year with his combination of power and speed.
Keibert Ruiz was the first half’s biggest underperformer, and his half splits are kind of bizarre. His wOBA/xwOBA marks essentially flip-flopped from one half to the other, meaning he was seemingly unlucky in the first half, then super lucky in the second half, which all likely offset each other and resulted in neutral luck for the year. That’s how this stuff is supposed to work!
Geez, I’ll never forgive myself for choosing Vladimir Guerrero Jr. instead of Freddie Freeman this year in the mixed LABR draft! The first time I owned Guerrero too, so I apologize to everyone else who drafted him for my curse. His xwOBA dropped significantly in the second half, so while he never rebounded off a seemingly unlucky first half, his skills faded. I’m curious how much cheaper he ends up in 2024 drafts and auctions coming off the disappointing year. Now we have to ask ourselves if his 2021 was the fluke, as it certainly looks like the major outlier right now. Personally, if I could pay for a high-20 homer guy with 90-100 RBI and around batting average neutral, then I’m all in, as the risk/reward at that price is intriguing.
I’m embarrassed to admit that I started Tim Anderson all season long in my 12-team mixed league, waiting, and waiting, and waiting, for him to rebound. He never did. Once again, the first time I’ve ever owned him! Always happens.
Mike Podhorzer is the founder of ProjectingX IQ, an advanced fantasy baseball analytics platform that transforms projection data and in-season performance signals into actionable intelligence. He is the 2015 Fantasy Sports Writers Association Baseball Writer of the Year and three-time Tout Wars champion. He is the author of the eBook Projecting X 2.0: How to Forecast Baseball Player Performance, which teaches you how to project players yourself. Follow Mike on X@MikePodhorzer and contact him via email.
I appreciate this exercise! Looking at the stats in a vacuum, with just the “A” and “B” first half statlines, I thought they would be about the same in the second half (“A” a little worse, “B” a little better, both landing around .340).
Then when I saw the names, I thought of course I’d take the “B” group, seems like a much better group of players! Funny how adding the names skewed my expectations so. (And I think the approach you took was the correct one, showing them in aggregate with the names removed for forecasting purposes)