Ottoneu Arbitration by Position
Last week, with Ottoneu Arbitration complete, we looked at where and how dollars were allocated, who was voted off, and more in an arbitration recap. Today, we’ll go deeper in another area, looking at arbitration by position.
The first obvious question is how allocations hit hitters vs. pitchers. I have suggested in that past that hitters are better targets than pitchers, and I think this is generally true. Obviously that isn’t universal, but hitters are less likely to get hurt (and even less likely to have a major injury that costs them a season or more) and are generally more reliable year-to-year, which means the dollars allocated to hitters are more likely to have an impact long term.
| Position | Players Receiving Allocations | Total Allocations Made | Total Dollars Allocated | Dollars Per League | Dollars per Allocation | Allocations Per League | Allocations per Player | Dollars Per Player |
|---|---|---|---|---|---|---|---|---|
| All Bats | 321 | 45382 | $63,238 | $173.73 | $1.39 | 124.7 | 141.4 | $197.00 |
| All Arms | 252 | 27657 | $38,694 | $106.30 | $1.40 | 76.0 | 109.8 | $153.55 |
| Shohei Ohtani | 1 | 1486 | $2,739 | $7.52 | $1.84 | 4.1 | 1486.0 | $2,739.00 |
| Bats without Ohtani | 320 | 43896 | $60,499 | $166.21 | $1.38 | 120.6 | 137.2 | $189.06 |
| Arms without Ohtani | 251 | 26171 | $35,955 | $98.78 | $1.37 | 71.9 | 104.3 | $143.25 |
I put the bottom three rows in there to note just how big and small an impact Ohtani has. Big because he accounts for over 2.5% of all dollars allocated and small because removing him doesn’t really change any of our pitcher vs. hitter numbers.
Hitters were targeted with about 63% of allocated dollars and while those dollars were spread across more players, among players who received at least one allocations, hitters were hit harder, on average. This came primarily from getting more allocations, rather than larger allocations. The driving factor here is not that hitters get $3 from each time while pitchers only get $1; it’s that hitters are more likely to have multiple teams pile on, while pitchers are not. Leaving Ohtani out for simplicity, pitchers account for 44% of players who received at least one allocation; they account for just six of 18 (33%) players who were allocated to 1000 or more times and just 10 of 38 (26%) of players who were allocated to 500 or more times. Once a manager decides to allocate to a pitcher, they allocate just as much as they would to a hitter. They are just less likely to make that decision in the first place.
Interestingly, pitchers account for 37% of allocations and for almost the same share (38%) of pre-arbitration salary, at least among players who received arbitration. They also account for 39% of salary dollars across all leagues. So pitchers are maybe ever-so-slightly underrepresented in arbitration, but mostly what we are seeing seems to be that pitchers just generally make up about 35-40% of the Ottoneu economy, whether in salaries or in arbitration.
I would have guessed that they were further underrepresented in vote offs, but that doesn’t seem to be the case – 39% of voted-off players were pitchers.
Despite getting just 39% of salary, pitchers account for 46% of rostered players in Ottoneu. Managers are less willing to spend on pitchers than on hitters, given hitters get 63% of the salary but only 54% of the roster spots, and they are less willing to make other managers spend on pitching, via arbitration.
I could argue that we should be allocating less to pitchers – if managers are already signaling that they’re willing to spend less on pitchers, maybe we should be allocating to them at a lower rate? – but I think there are a couple of counters to that. First, we are maybe in a unique situation where arguably the three best pitchers in fantasy baseball – Tarik Skubal, Garret Crochet, and Paul Skenes – are all players who emerged from injury or college relatively recently and therefore are still somewhat underpriced. Second, if managers are most cost-sensitive on pitchers, allocations to pitchers will hurt more. If your goal is, in part, to make the other manager hate the allocations, hitting pitchers might be a good way to do that.
Among hitters, there aren’t a ton of surprises. The table below breaks down allocations by position. I account for multi-position players here by assigning them their most valuable position, in this order: C, 2B, SS, OF, 3B, 1B, U.
| Position | Players Allocated To | Allocations | Amount Allocated | Dollars per League | Amount per Allocation | Allocations Per League | Allocations Per Player | Dollars Per Player |
|---|---|---|---|---|---|---|---|---|
| C | 33 | 4978 | $7,328 | $20.13 | $1.47 | 13.7 | 150.8 | $222.06 |
| 1B | 30 | 5594 | $8,147 | $22.38 | $1.46 | 15.4 | 186.5 | $271.57 |
| 2B | 59 | 3398 | $4,171 | $11.46 | $1.23 | 9.3 | 57.6 | $70.69 |
| SS | 39 | 7603 | $10,071 | $27.67 | $1.32 | 20.9 | 194.9 | $258.23 |
| MI | 98 | 11001 | $14,242 | $39.13 | $1.29 | 30.2 | 112.3 | $145.33 |
| 3B | 23 | 3181 | $4,673 | $12.84 | $1.47 | 8.7 | 138.3 | $203.17 |
| OF | 127 | 19090 | $26,046 | $71.55 | $1.36 | 52.4 | 150.3 | $205.09 |
| U-only | 10 | 1538 | $2,802 | $7.70 | $1.82 | 4.2 | 153.8 | $280.20 |
| All Bats | 321 | 45382 | $63,238 | $173.73 | $1.39 | 124.7 | 141.4 | $197.00 |
| SP | 185 | 26146 | $36,888 | $101.34 | $1.41 | 71.8 | 141.3 | $199.39 |
| RP | 67 | 1511 | $1,806 | $4.96 | $1.20 | 4.2 | 22.6 | $26.96 |
| P Overall | 252 | 27657 | $38,694 | $106.30 | $1.40 | 76.0 | 109.8 | $153.55 |
Second base is the clear outlier here, with just $11.46 per league assigned to the position. Util-only is lower, but that is basically just one player; $2739 of the $2802 allocated to utils went to Shohei Ohtani.
It shouldn’t be a surprise that 2B is so low. The position was something of a was wasteland in fantasy this year and it’s hard to think of any true breakouts at the position. Brice Turang and Maikel Garcia. Luke Keaschall, maybe? Jorge Polanco bounced back. But all of those guys have enough question marks, especially in the most common Ottoneu formats, to limit their appeal as arbitration targets. In vote off leagues, the 2B-hate was even more extreme. Ketel Marte, Turang and Garcia were the only 2B voted off a team, and they were voted off four teams total.
Maybe more surprising is that 3B was lower than any other position, but that is a little misleading. While there was $73.95 per league assigned to OF, there are five OF spots in the lineup and most rosters have 8-12 OF vs. maybe only one or two 3B. But even if you look at dollars per player, 3B is pretty clearly the second-least targeted position.
I wondered if maybe this was simply due to individual players – say, Cal Raleigh – driving up a given position. If catcher is highly concentrated on one player, if might be that 3B was more of a target than C, but Raleigh flipped that himself. That isn’t actually how it played out.
| Position | Top Allocation Receiver | Amount Received | Position Dollars | Dollar Share | Allocations Received | Position Allocations | Allocation Share |
|---|---|---|---|---|---|---|---|
| C | Cal Raleigh | $4,135 | $7,328 | 56.4% | 2259 | 4978 | 45.4% |
| 1B | Nick Kurtz | $3,541 | $8,147 | 43.5% | 1908 | 5594 | 34.1% |
| 2B | Ketel Marte | $725 | $4,171 | 17.4% | 528 | 3398 | 15.5% |
| SS | Bobby Witt Jr. | $1,754 | $10,071 | 17.4% | 1168 | 7603 | 15.4% |
| 3B | Junior Caminero | $3,001 | $4,673 | 64.2% | 1815 | 3181 | 57.1% |
| OF | James Wood | $2,440 | $26,046 | 9.4% | 1597 | 19090 | 8.4% |
| U | Shohei Ohtani | $2,739 | $2,802 | 97.8% | 1486 | 1538 | 96.6% |
| SP | Paul Skenes | $3,838 | $36,888 | 10.4% | 2185 | 26146 | 8.4% |
| RP | Mason Miller | $378 | $1,806 | 20.9% | 314 | 1511 | 20.8% |
As much as Raleigh individually carried C, Junior Caminero did even more for 3B, pulling in 57% of the allocations and 64% of the dollars assigned to the position. Yes, outside of Raleigh, catcher doesn’t look as exciting from an arbitration perspective, but outside of Caminero, 3B looks even worse.
The caveat here could be that Caminero “benefits” here from all the 3B/OF eligible players being classified as OF for my analysis. But only three players who received at least one allocation – Addison Barger, Noelvi Marte, and Otto Kemp – are 3B/OF and not MI. Those three account for 228 allocations and $271 dollars. Those numbers decrease the concentration at 3B, but Caminero is still by far the single biggest impact on a given position (outside of Shohei Ohtani at util).
My big take-aways here:
Second base is as bad as you think. Yes, there are a large number of 2B-eligible players who received allocations, but you need to roster more 2B than most other spots and there is a reason those players didn’t receive very large allocations. That said, there is another lesson from the large number of 2B who were hit with allocations…
Second base is deeper than you think. At least relative to the top of the position. Part of this is because the top of the position is so weak that the gap from the 12th best option to the 24th best option isn’t that huge. There were 59 2B who received arb and just 39 SS. If we allow 2B/SS eligible players to qualify at both, that goes up to 62 SS and 59 2B, which is still very close. Look at this comparison of 2B and SS based on current Depth Charts projections:
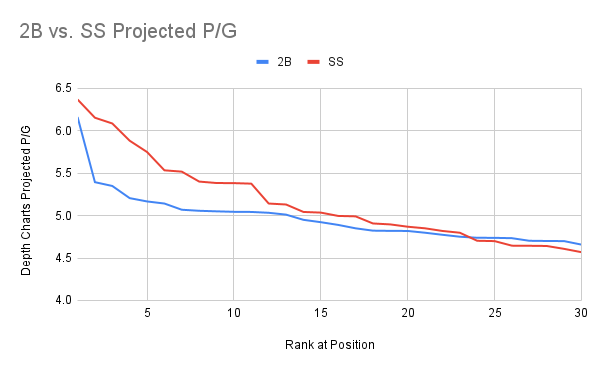
The gap from 2B5 to 2B15 isn’t nothing, but it is much smaller than SS5 to SS15. And leagues will start 36 MI everyday, which requires rostering at least 48 and typically more like 60 MI.
Also, this chart makes 2B look worse than it should, since 2B/SS-eligible players show up on both lines and probably shouldn’t. Brendan Donovan and Maikel Garcia are SS12 and SS 14, respectively. They are 2B6 and 2B11. They should probably both be used at 2B. If I make that same graph but push any SS/2B eligible player to 2B, the lines cross much earlier – around the 18th best at each spot – and after that 2B is stronger. That means that once you get past the 36 required MI to start, 2B and SS aren’t really that different. Go find a good starting 2B, because there aren’t that many, but 2B depth really isn’t any harder to find than SS depth.
Third base might be worse that you think. The 3B who aren’t also MI-eligible and are rostered in over 50% leagues right now are: Eugenio Suarez, Junior Caminero, Noelvi Marte, Addison Barger, Isaac Paredes, Matt Shaw, Jose Ramirez, Alex Bregman, Manny Machado, Sal Stewart, Matt Chapman, Max Muncy, Royce Lewis, Austin Riley, Mark Vientos, Miguel Vargas, Alec Bohm, Josh Jung, Connor Norby, and Ryan McMahon. That’s 20 names, but a couple of them can fit into the OF, and a number of them have big question marks around them. The five 3B who received allocations and are not on this list are Nolan Arenado, Warming Bernabel, Ke’Bryan Hayes, Brady House, and Deyvison De Los Santos. They don’t really help much. I knew I wanted to be strong at 2B pre-auction, but I think 3B is next on that list of positions I am worried about.
A long-time fantasy baseball veteran and one of the creators of ottoneu, Chad Young's writes for RotoGraphs, and can be heard on the Keep or Kut Podcast. You can follow him on Bluesky @chadyoung.bsky.social.
How in the world did these guys receive allocations?