Not Impossible, Just Improbable: Beat the Streak Is Back!
You may remember, in the before times, a game called Beat the Streak. The game challenged baseball fans to hypothetically beat one of the greatest records of all time. The idea was to pick one player each day to get a hit and to do that 57 consecutive times, beating Joe DiMaggio’s 56 game hit streak record. Way back in preseason 2020 I wrote about my ambitions of becoming a millionaire by using predictive, machine learning models to aid in winning the competition. The game’s 2020 cancellation gave me time to think, time to read, time to learn how noisy my upstairs neighbors are, and time to build a better model.
As you can imagine, this is hard to do. Many have tried, all have failed and some have pointed out the insanely low probability of actually reaching 57. But whether you’re attempting to actually beat those very, very small odds, or you’re just looking for daily fantasy production, predicting daily hit probabilities can be useful. This seems like a natural fit for machine learning, so fit we will!
If you could give a computer some variables to learn from, let’s say 10 or less, what variables would you choose? What factors would you say are most important to a hitter, getting a hit? You might think of righty/lefty matchups. Ok, check. What else? Think about this from the manager’s point of view when trying to set the lineup. Kiley McDaniel and Eric Longenhagen discuss this exact situation in their book, Future Value:
“There’s a lot of ideas to consider when a manager is setting a lineup for the game that night….The most important concepts to consider in this situation are the plane of the pitchers’ fastball to the plate and the plane of the hitter’s swing through the zone…[I]magine the hitter being a power hitter who hits the ball in the air and has the bat speed to get away with having a bit of a longer path to the zone (think Ronald Acuna), designed to increase bat speed and scoop the ball into the air. The ball is steep coming down from the pitcher’s hand, much steeper than average, and the hitter’s swing path is also steep coming up at the ball, also much steeper than average. You can see why this is a good matchup, all else being equal, his swing path is “on plane” with the pitcher for a longer time, giving him margin for error.”
That’s a lot to consider for a manager, but not for a computer and if I were the manager, I would be using a model to tell me which players were most likely to hit tomorrow’s starter. Ok, I would have an analyst build me a model to tell me all that stuff, preferably in short order. Beat the Streak allows me to play the role of analyst and manager, fun! Here are a few rows of training data, or data the computer initially learns from:
| Pitch Type | Release X | Release Y | P Throws | B Stands | Plate X | Plate Z | LA | Spin Rate | Park Factor | Hit | |
|---|---|---|---|---|---|---|---|---|---|---|---|
| 1 | SL | -0.84 | 6.82 | R | R | 0 | 2.03 | -21 | 2154 | 99 | 0 |
| 2 | SL | -1 | 6.87 | R | L | 0.4 | 2.41 | -44 | 2203 | 100 | 0 |
| 3 | FF | -1.34 | 6.71 | R | R | 0.02 | 2.23 | 11 | 2368 | 99 | 1 |
| 4 | FF | -1.1 | 6.6 | R | L | 0.54 | 1.75 | 3 | 2348 | 97 | 0 |
| 5 | SL | -1.14 | 6.83 | R | R | -0.15 | 1.83 | -35 | 2300 | 101 | 0 |
The model is learning from all of these unique combinations and determining what patterns create a hit. Keeping it simple limits the number of unrealistic assumptions I have to make when I deploy my model. For example, I can’t know for sure whether there will be a shift on or not. Beat the Streak forces me to make my pick before the National Anthem is even sung, so there’s only so much you can prepare for. But, I do know what a certain pitcher’s average fastball spin rate is and I can adjust that as the season goes on. From the variables I did use, here’s what the model says is most important when predicting a hit:
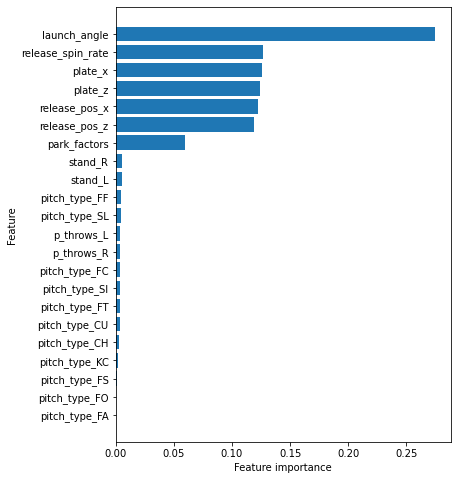
Since I’m using a random forest model to predict my target, the feature importances are a little different than the coefficients of a regression. If you’re interested, you can read about how they’re calculated here. The computer says, “Ok, I’ve learned what makes a hit and what doesn’t and now I’m a trained model.” But now I, the human, need to feed that trained model fresh, new data. The problem is, I don’t know what pitchers will throw and what will be the resulting location, but I can assume that they will do something similar to what they’ve done in the past. The same goes for the hitter and their launch angle.
On opening day, the model predicted Michael Brantley was likely to hit. It chose Michael Brantley, only because it thought Chris Bassitt’s pitch plane and Brantley’s swing plane would equate to a hit. Of course, Bassitt had to throw some pretty specific pitches. Something like this:
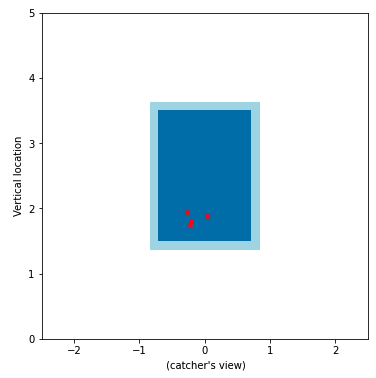
That shouldn’t be too hard to believe, right? The idea of Bassitt throwing a slider low in the zone didn’t throw any red flags. Brantley went 3 for 4 and got 2 of those hits off of Bassitt. My model predicted Brantley to get a hit off a slider thrown low in the zone, yet it was a changeup more towards the middle of the zone that resulted in Brantley sliding into 2nd.
A comparison of what the model predicted (above) and what actually happened can provide some insight as to whether or not the model is totally random, or providing some help. Pitch locations (plate_x and plate_z in the image above) are much more important, by the model’s standards than pitch type. But leave a changeup right there in the middle of the zone like that and a professional like Brantley is going to hit it. Was it a lucky guess, or is there something the model is picking up on that I otherwise wouldn’t? It’s simply too early to tell. Here’s the model’s performance so far, which I’m calling “Jolt” in honor of the true record holder, Joe DiMaggio:
| Date | Pitcher | Home Team | Batter | LA | Outcome | |
|---|---|---|---|---|---|---|
| 1 | 4/1 | Chris Bassitt | OAK | Michael Brantley | 10.2 | 3-for-4 |
| 2 | 4/1 | Kyle Hendricks | CHC | Bryan Reynolds | 10.2 | 1-for-4 |
| 3 | 4/2 | Antonio Senzatela | COL | Corey Seager | 11.9 | 3-for-5 |
| 4 | 4/3 | Zach Plesac | DET | Jeimer Candelario | 12.1 | 3-for-4 |
| 5 | 4/4 | Adrian Houser | MIL | Luis Arraez | 11.4 | 3-for-3 |
| 6 | 4/5 | Matt Shoemaker | DET | Jeimer Candelario | 13.3 | 0-for-4 |
I’ve been fascinated with the challenge the last few season. Several factors I’d also have the model consider.
With today’s bullpens and shorter pitcher starts, I’ve also included the strength of a bullpen as a factor, using the RP positional war estimates from the zips article.
I also look for hitter’s who perform well on the road since the away team is always guaranteed to bat in the 9th where as a home team can miss the 9th if they’re ahead. Generally favoring teams in a better lineup as well to increase the chances of more hits and times through the lineup. I think taking a look at average plate appearances per game is a good way to look at it.
I’m also considering team defense and looking for teams in the bottom 10 by DRS. I’m also looking for the most consistent hitters, some have good averages but are streaky, I prefer to track how many games a hitter gets at least one hit.
Great points. So far this season, I’ve used Jolt as a starting point. I’ve taken the top 10 picks by the model and dissected them more, trying to find the best pick out of 10. All the factors you mentioned are perfect for narrowing down that initial 10. Good luck!
What language/tool did you build the model in R? Python? I’m using the project to build out my python skills.
I’d also be interested in learning more about the how as an amateur data scientist myself. I haven’t played around much with anything (mostly just trying to absorb concepts) and mixing in baseball seems like the easiest way to learn more. So I’ll start with a couple newbie questions – what’s the best source of data for a developing a model? Does FG have an API I could connect to? Best to extract csvs from the leaderboard pages? A best method to account for current season data?
Mostly any starting points would be largely appreciated, thanks for the rather interesting article. Looking forward to seeing more about it.
FanGraphs leaderboards are certainly a great place to start. I use Python library called pybaseball (https://github.com/jldbc/pybaseball) which acts as an API for various datasets.
I’m really more of a pen and paper guy….just kidding. I used Python here. I’m hoping to post this project to my GitHub page once I can clean it up and make it a little more presentable:
http://www.GitHub.com/lucaskelly49