Mike Burrows: Ottoneu P/IP Gainer
First half/second half splits can be misleading. Inevitably, we will find ourselves in March, watching the hype increase on multiple players who were brilliant from mid-July to the end of the season, while wondering, “Was this real improvement? Just a hot streak? Should I fade the hype or buy in before the price gets even higher?” And some of those players will crash and burn and be cuts by May. And some will be legit breakouts. It’s risky to get too excited about short-term performance, but that doesn’t mean we can’t learn something by identifying players whose second half was a big departure from their first.
Over the off-season, we’ll take a look at some players who may have broken out in the second half – and some who may have done the opposite. I am going to start with a pitcher today. The list of “candidates” for this is a set of 114 pitchers who had at least 30 innings as a starter in both the first and second half. That does leave some blind spots – “bulk” guys who pitched behind openers even a couple times might be missed. Players who were shut down early or got a late start might be missed. But it’s an interesting set of players to look at.
I sorted these pitchers by the difference between their first half and second half P/IP. It’s worth noting that some change is normal. Here is a complete list of the pitchers who neither gained nor lost more than 0.1 P/IP between the halves:
- Clay Holmes
- Cade Povich
- Paul Skenes
- Edward Cabrera
- Chris Bassitt
- Luis Castillo
- Logan Allen로건
- Quinn Priester
- Freddy Peralta
- Bryan Woo
That means that more than 91% of pitchers in this dataset gained or lost at least 0.1 P/IP. More than 83% gained or lost at least 0.3 P/IP. It’s also interesting to me that most of these guys were pretty good. Skenes stands out, but Woo, Peralta, Castillo, Priester, and Cabrera were all good this year and Bassitt and Holmes were at least somewhat useful.
I’ll also note that this “stability” wasn’t necessarily “stable.” Allen’s last six weeks included a -25 point start and a nearly-60 point start less than a month apart. Povich’s performance was up and down all year. Turns out, being similar in the first and second half doesn’t mean you were actually reliably stable all year.
With that, let’s dive into our first Ottoneu P/IP gainer.
Mike Burrows – Gained 3.06 P/IP, from 2.61 to 5.68
This is pretty obviously a huge change, as he more than doubled his per-inning score from the first half to the second. Burrows first and second half are also a nice little lesson on why we should use K% over K/9.
| Half | K% | K/9 | BB% | BB/9 | BABIP |
|---|---|---|---|---|---|
| 1st Half | 23.0% | 9.22 | 9.3% | 3.73 | 0.310 |
| 2nd Half | 25.1% | 9.00 | 6.4% | 2.29 | 0.280 |
His K/9 went down! He struck out fewer batters! But his K% went up? Basically, Burrows got more efficient at piling up strikeouts, but also got more efficient at avoiding walks and either he or his defense or both got more efficient at turning balls in play into outs. His HR/9 also went down by half. He didn’t really strike out fewer batters per nine innings, he faced fewer batter per nine innings.
You can see more of what drove that improvement in two graphs. First, his plate discipline numbers:
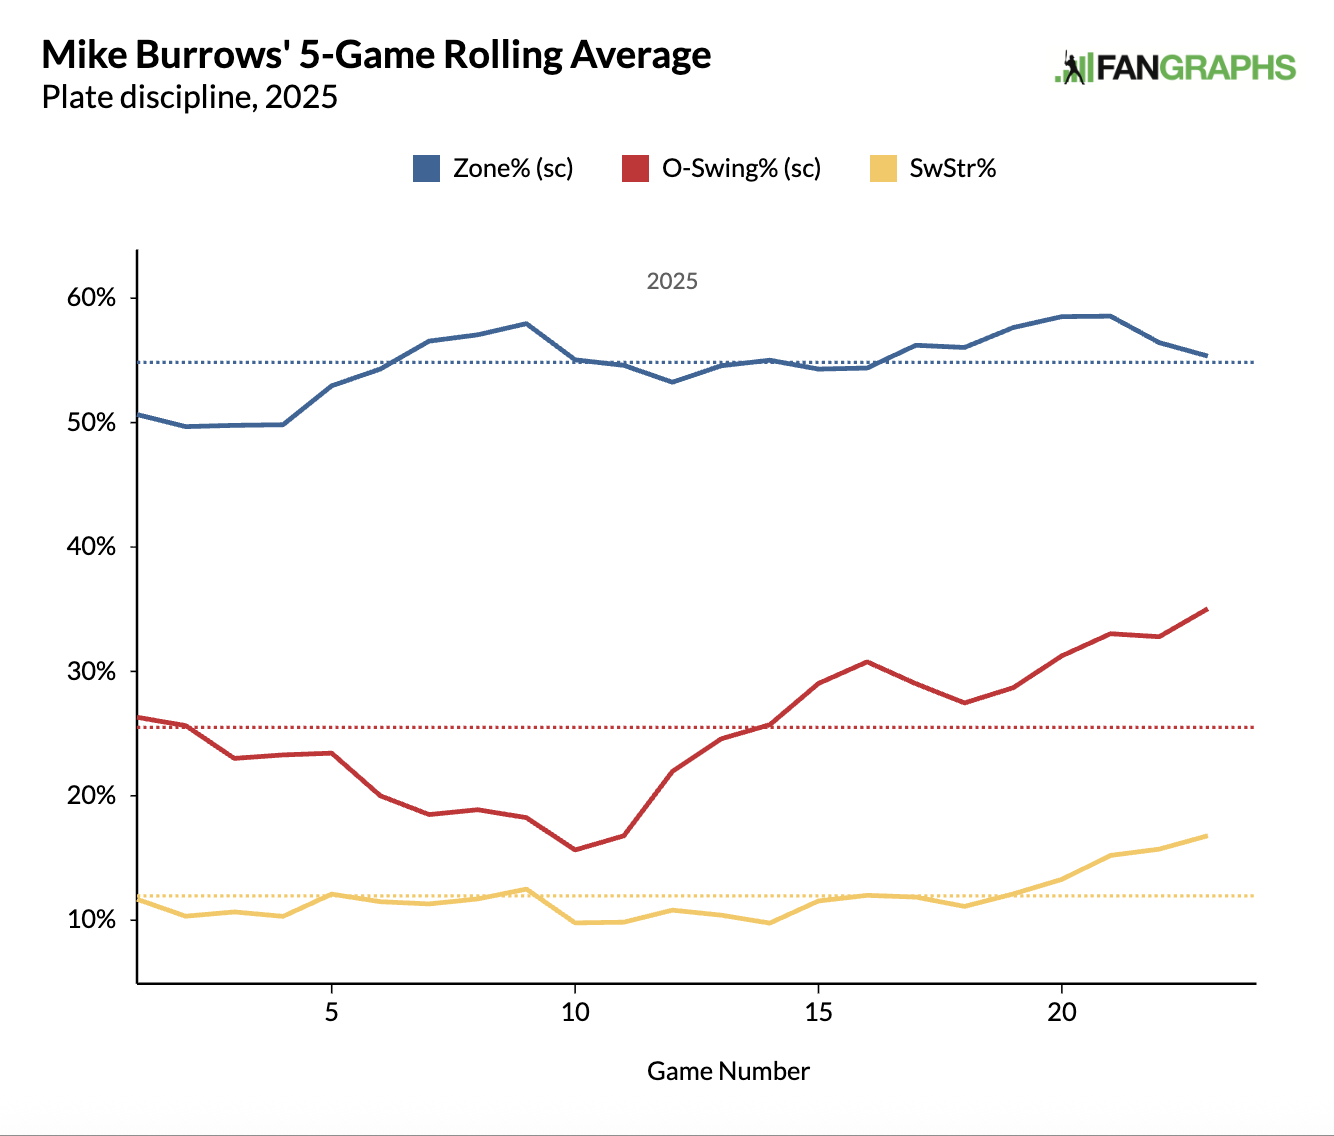
His pitches were in the zone more often, which will help avoid walks. And when they weren’t in the zone, he induced a lot more chase, which will also help avoid walks, and create lower quality contact, and help with the yellow line: his increased his swinging strike rate.
And what happened when batters did make contact?
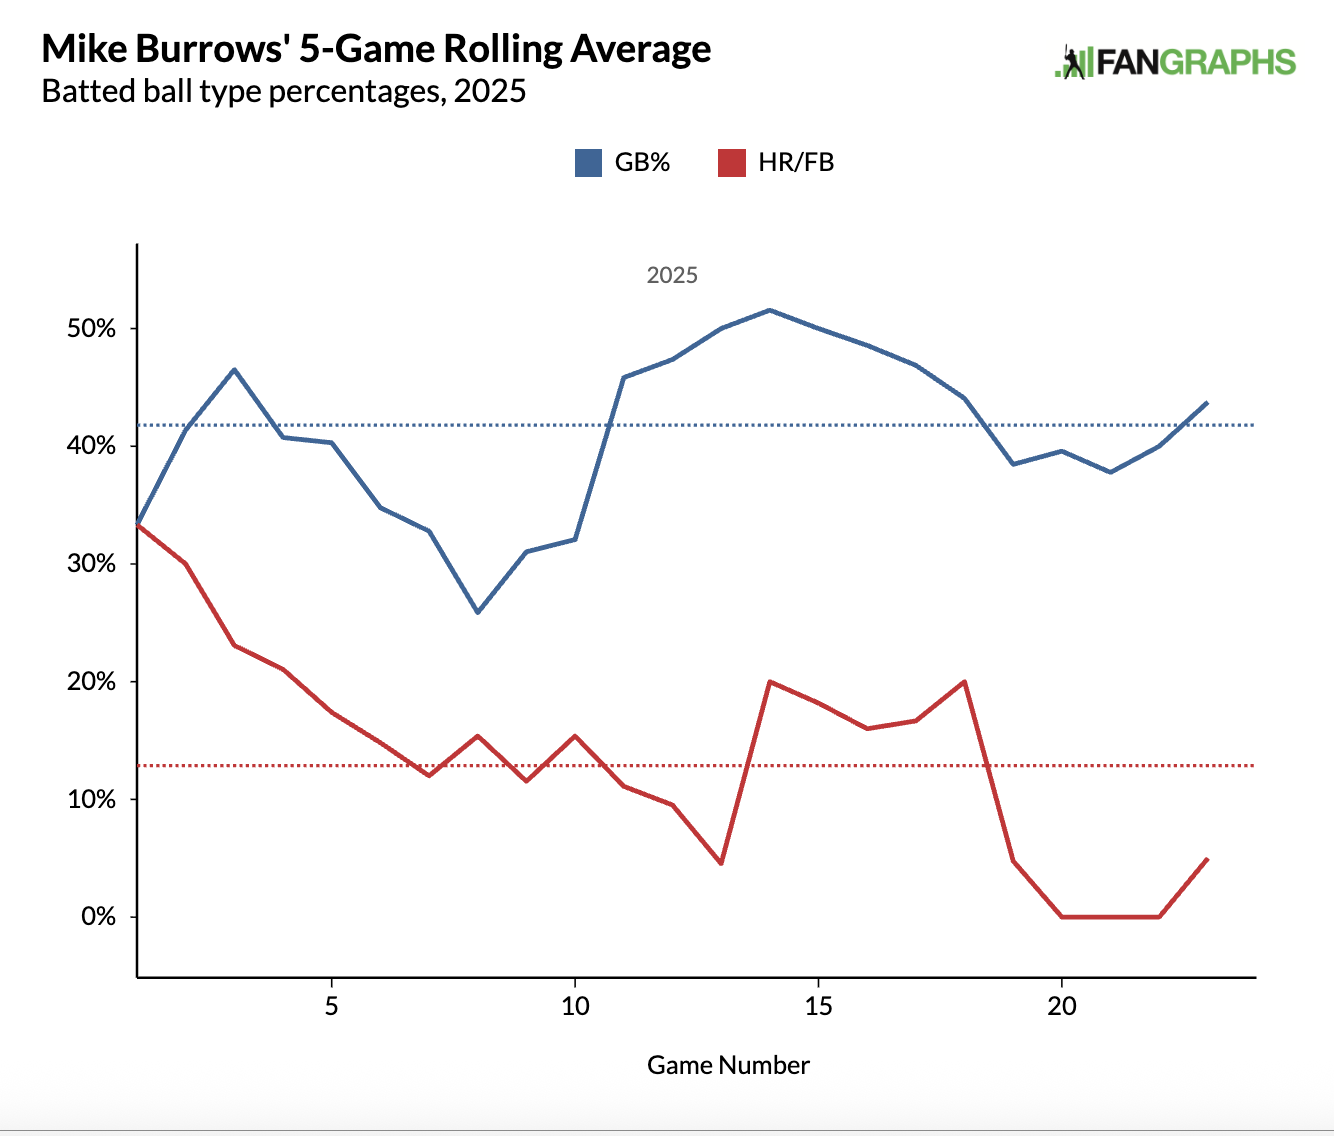
More grounders and lower HR/FB rate. Giving up fewer fly balls while allowing fewer of those fly balls to turn into HR is going to lead to good results.
But for our purposes, the real question is how or why did he suddenly get so much better – and is it sustainable?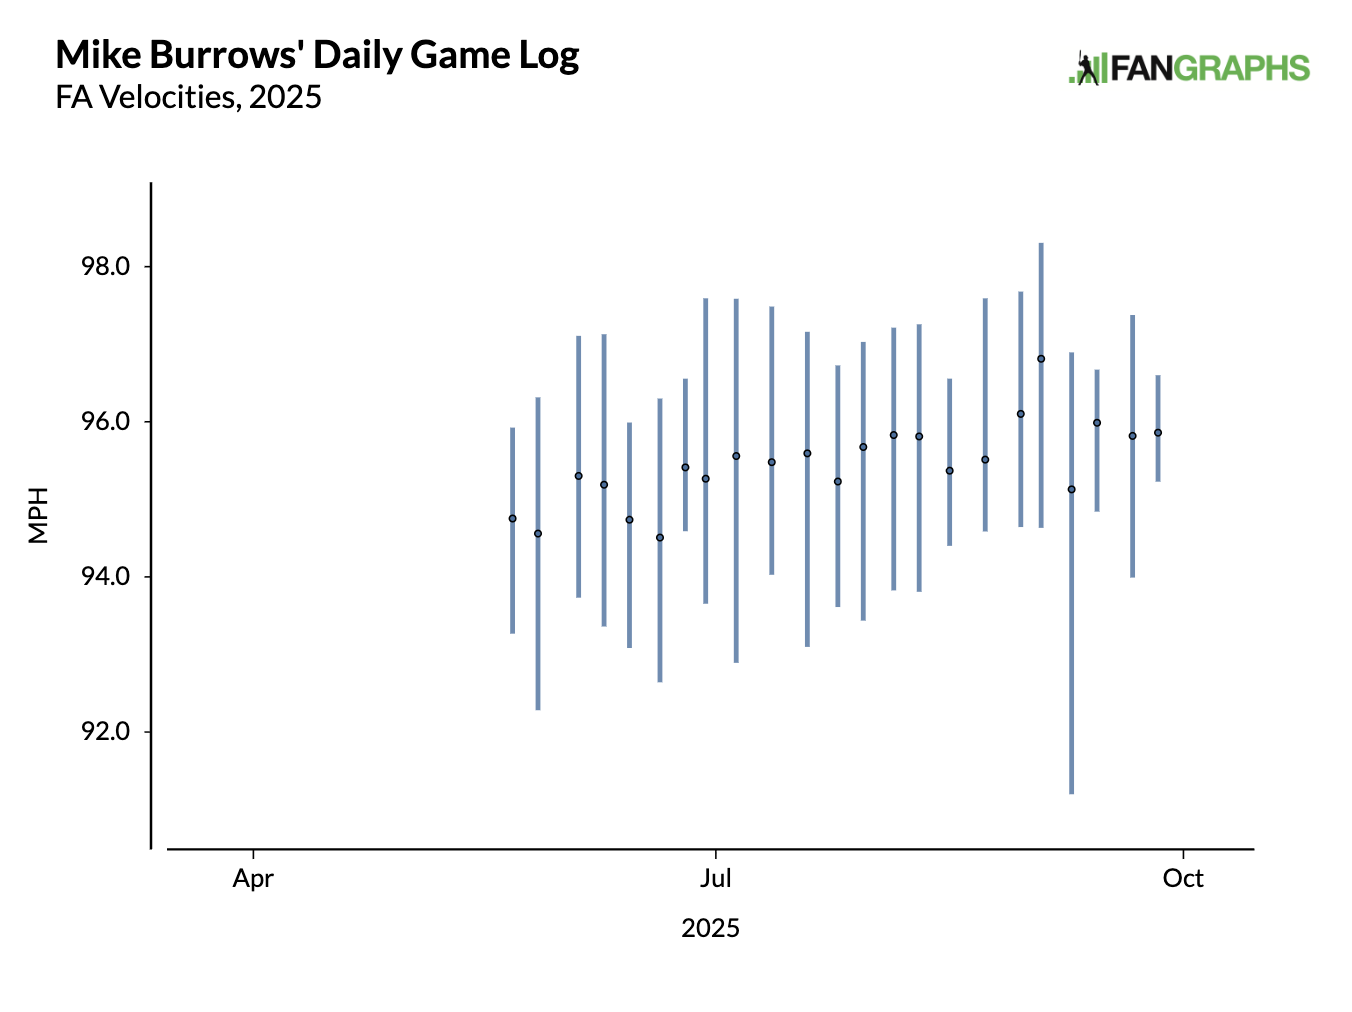
That is certainly part of the story. Burrows averaged 95.1 on his fastball in the first half and 95.9 in the second. Plus, that 95.9 is skewed downward by one outlier start – his fourth to last. That was his most-used pitched, thrown nearly 40% of the time. Adding almost 1 mph to your fastball will make you better.
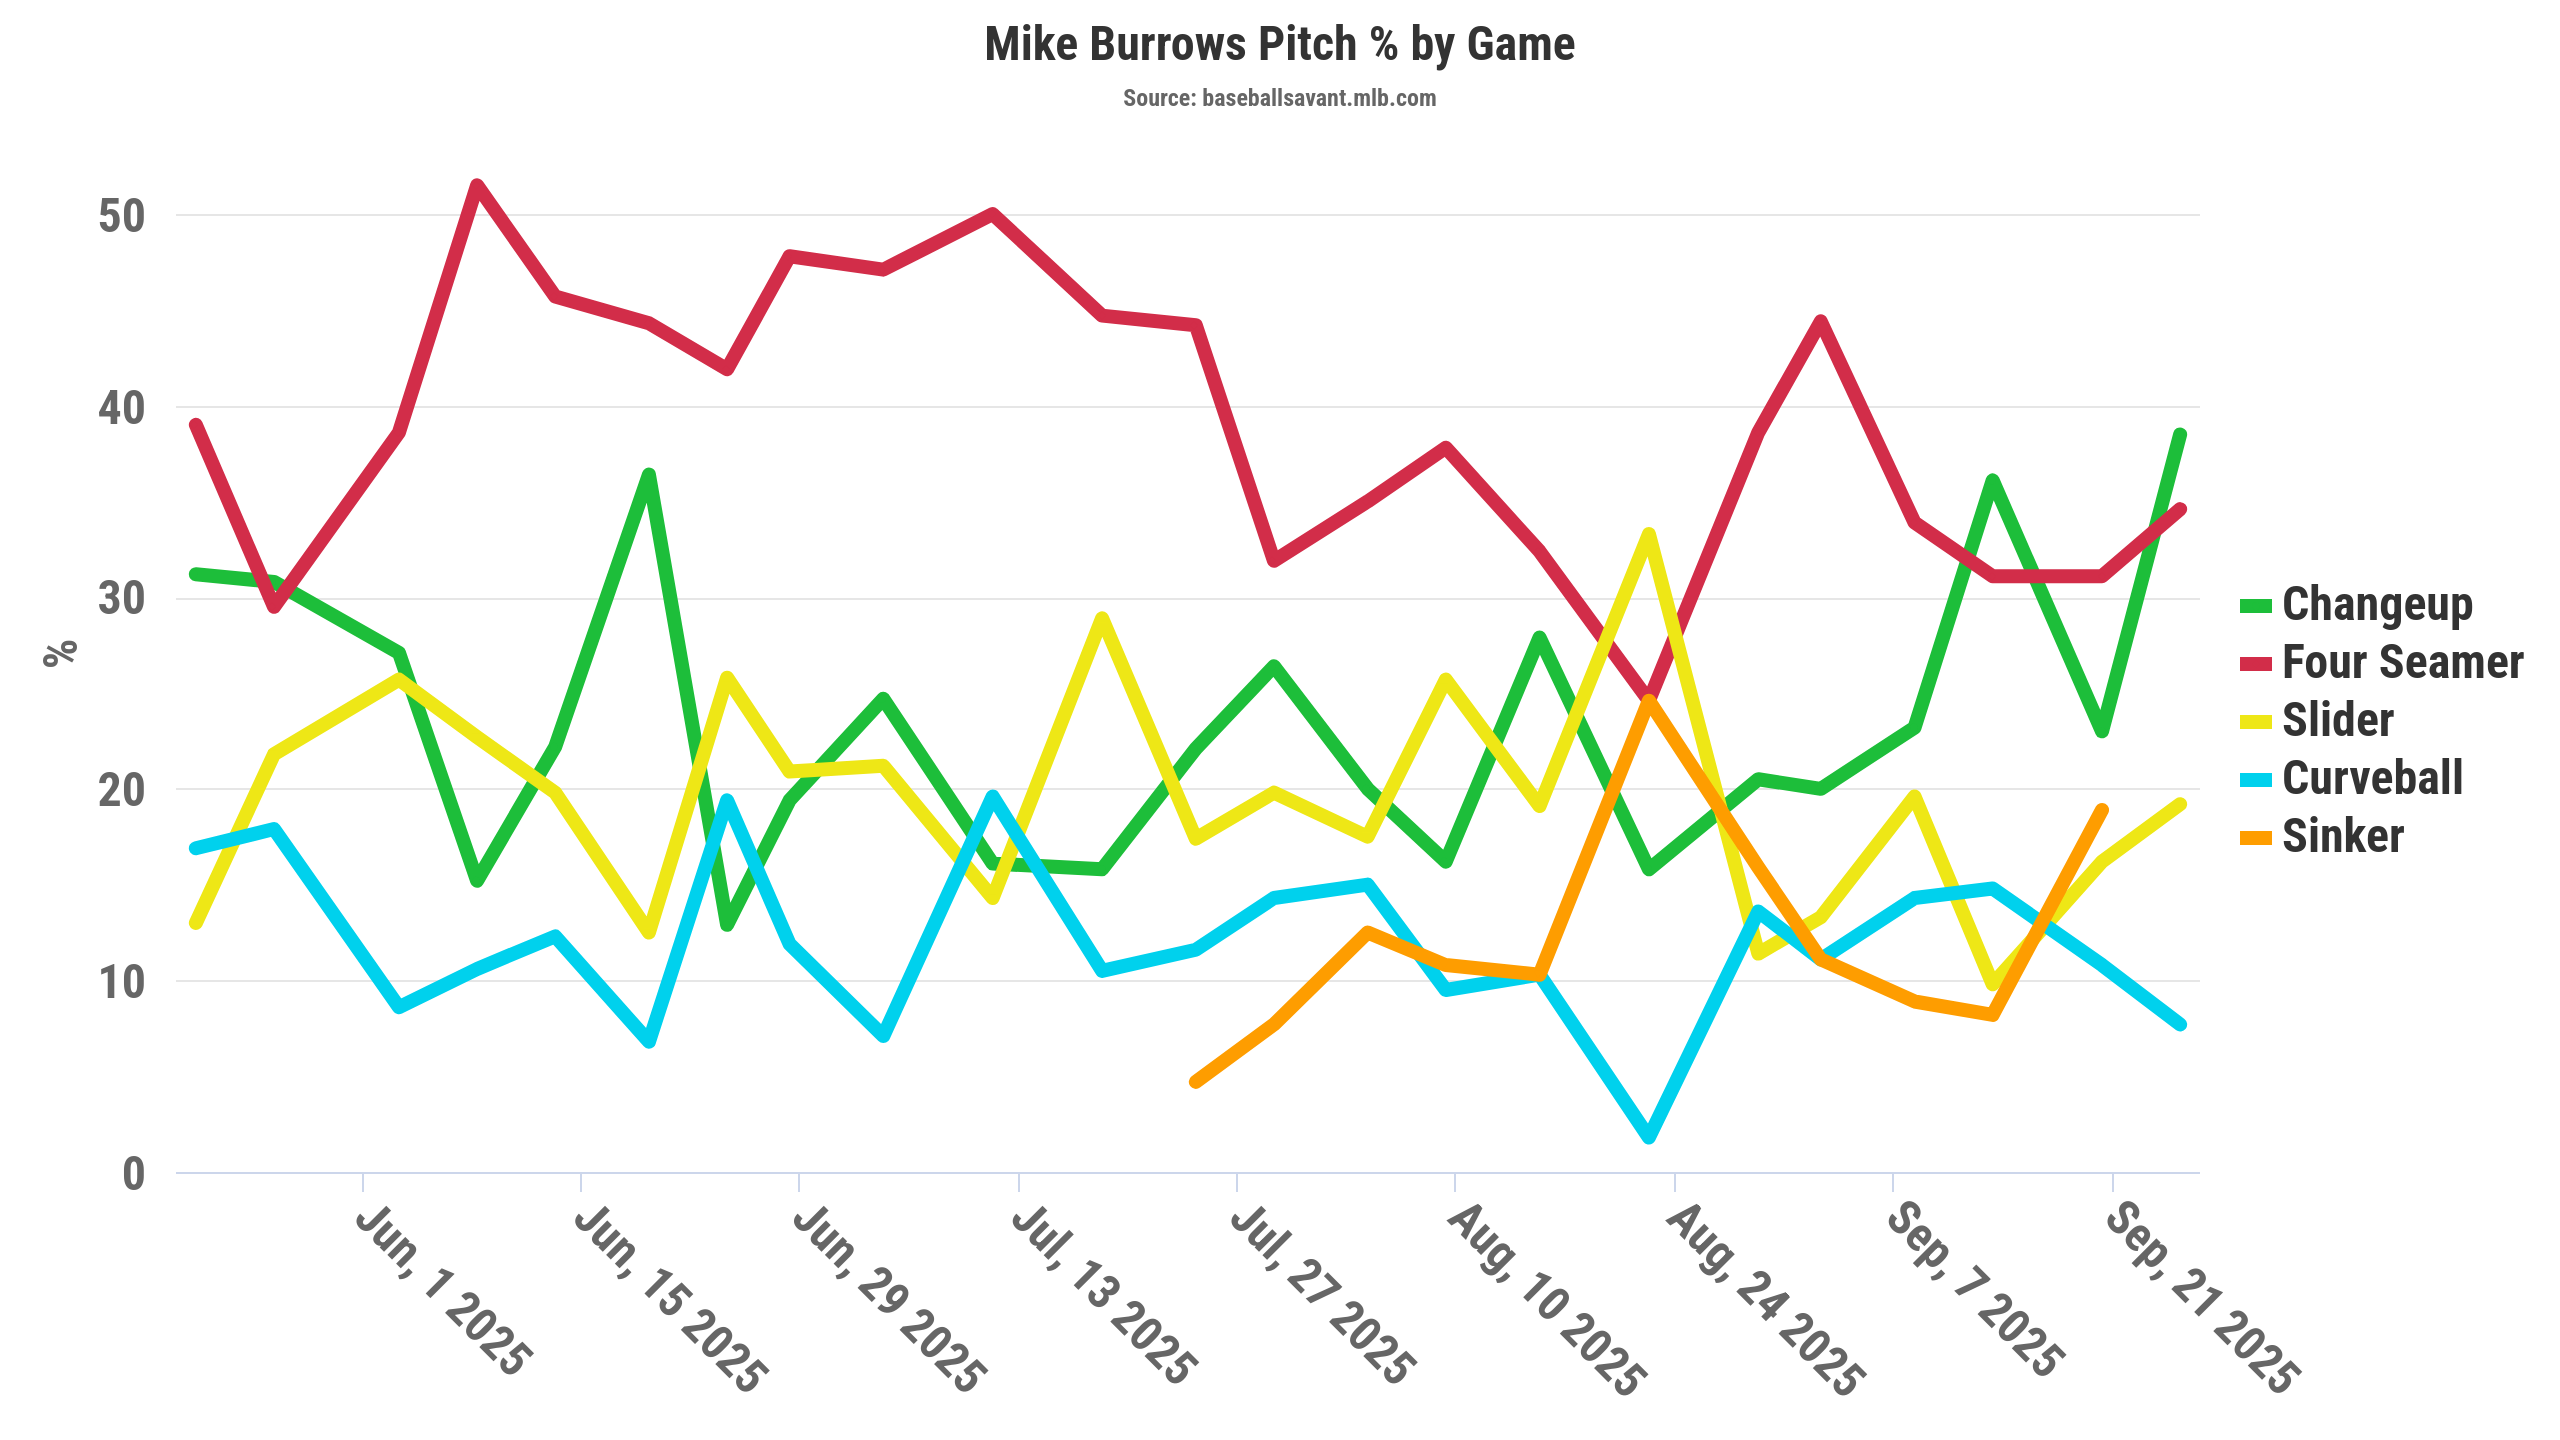
This probably tells some of the story, too. It’s a bit jumbled but three things stand out to me:
- His four-seam usage goes down over the season. It’s not straight down, but he was regularly using it 50% of the time early in the year, and under 40% for most of August and September.
- After months where his #2 pitch shuffled around – mostly his change or his slider, but his curve also made an appearance as his second-most used pitch – by late August he had firmly established his changeup as his primary secondary.
- He introduced a sinker in late July, and slowly ticked up usage over the remainder of the season.
Having a second fastball to go to is extremely valuable. And this sinker looks pretty useful.
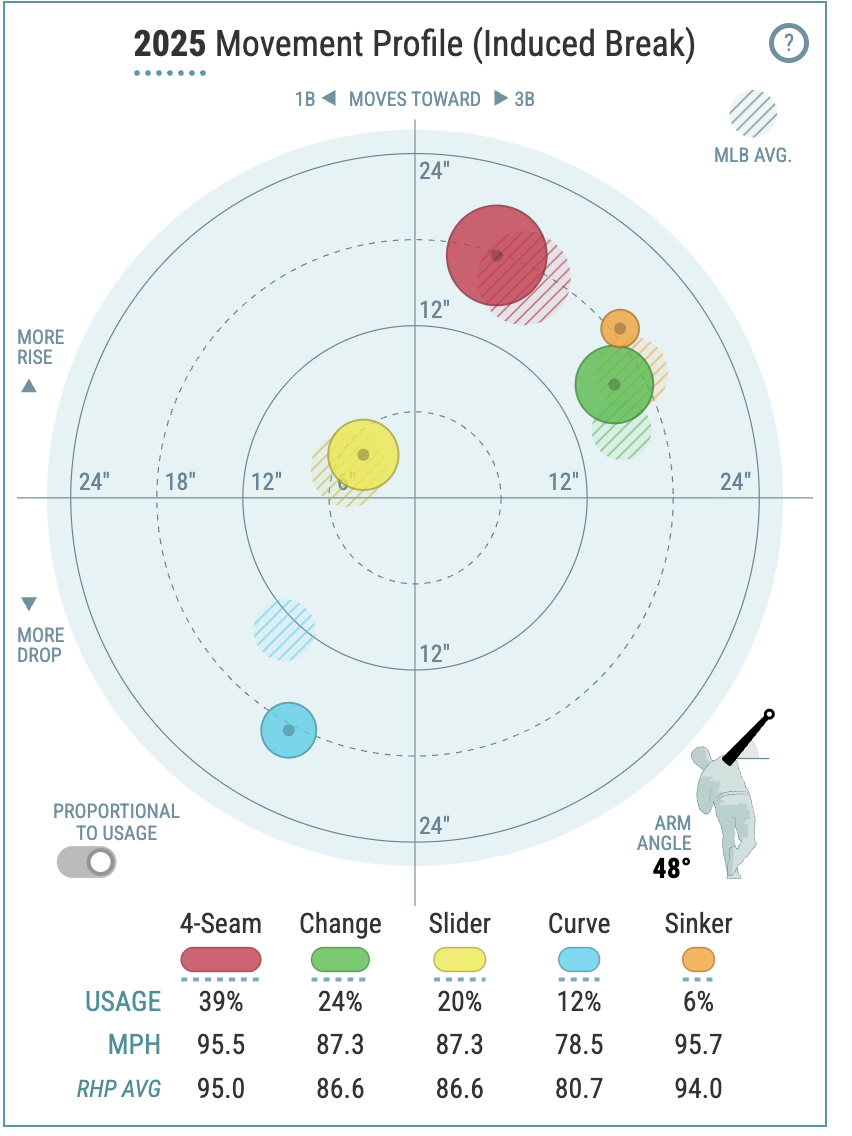
He throws both fastballs nearly 96 mph (remember, the four-seamer was sitting higher by the time he introduced the sinker), but their movement is so different. They show up at the same time, but in totally different places. Meanwhile, his sinker moves quite a bit like his changeup, but is more than 8 mph harder. It shows up in the same place, but at a totally different time.
What I like most about this is that is that it looks like a pitcher actively refining and improving his repertoire. He didn’t just have more success, he went out an found ways to become a better pitcher. Stuff+ sees it too. His Stuff+ on his four-seamer is 86 for the season. From August 30 on, it was 99. Now, 99 isn’t great, but it’s not bad! And over that stretch, his other pitches improved, too. His slider actually dipped from 104 on the season to 102 in that stretch, but his sinker (102 up from 99), change (110 up from 105), and curve (92 up from 91) all improved. That gave him three above average pitches and one more almost exactly average. His season long Stuff+ overall was 96. It was 102 from August 30 on.
I am not about to tell you his second-half 5.68 P/IP is legit. But he is a guy I want to target at low cost in trades this off-season or in drafts. He made a ton of progress and I have to wonder how much more he can make in the off-season.
A long-time fantasy baseball veteran and one of the creators of ottoneu, Chad Young's writes for RotoGraphs, and can be heard on the Keep or Kut Podcast. You can follow him on Bluesky @chadyoung.bsky.social.
Would you keep at $3 just to see what happens?
I think so. We can see what the talk track on him is in January, but any hype at all and he’s going to go for more in auctions.
A lot of those 2nd half improvements happened when he was piggybacking with Chandler and only throwing 3 or 4 innings. We’ll see if he can hold up the third time through the order over a full season.
If he had simply reduced his repertoire and used a RP approach, sticking with two pitches, I might be more concerned about that. But adding a pitch and shifting his balance while still using all his pitches is really intriguing to me.