Martín Pérez vs. Detroit Tigers: When Bad Meets Bad, What Happens?
Every Sunday, Fred Zinkie and I spend between 30 minutes to an hour going over the three teams we share. The first words out of his mouth this week was, “I think we should add Martín Pérez.” And my first thought was that the smooth Canadian had been drinking a little too much. In classic Fred fashion, he went into detail that while Martin is a subpar pitcher and facing the Tigers who have struggled against left-handed pitching. As a team, the Tigers have a 38% K%, .467 OPS, and 33 wRC+.
I didn’t know how to how to evaluate the results when a pathetic pitcher faces an even more pathetic offense so, considering Fred’s performance history, I let him add away without too much of a fuss. I didn’t have a simple response, but I do now and I should have been suspicious of his proposal.
For the correct retort, I needed to know two things. First, if a team is struggling against a certain handedness of a pitcher in one month, how do early-season struggles compare to the end-of-season results. Then, I needed to find out how pitchers performed knowing the end-of-season results? With both, I should have a decent answer. It’s time to crunch some numbers.
For this study, I looked at how teams performed against left-handed pitchers for the last five full seasons (2015 to 2019) using wRC+ for the hitter’s talent.
From this five-year sample, the Tigers have been historically bad. Here are the 11 teams with a wRC+ under 60 in March and April and how they hit over the rest of the season.
| Team | Season | Mar/Apr wRC+ | May wRC+ | Mar to May wRC+ | Season wRC+ |
|---|---|---|---|---|---|
| SDP | 2017 | 59 | 56 | 58 | 79 |
| PIT | 2019 | 58 | 81 | 68 | 76 |
| BOS | 2016 | 57 | 173 | 131 | 111 |
| OAK | 2015 | 52 | 83 | 74 | 97 |
| PHI | 2016 | 50 | 75 | 63 | 77 |
| ATL | 2016 | 50 | 65 | 57 | 81 |
| BOS | 2018 | 46 | 124 | 83 | 93 |
| TEX | 2017 | 43 | 91 | 67 | 89 |
| CHW | 2015 | 40 | 51 | 46 | 77 |
| KCR | 2017 | 39 | 86 | 67 | 89 |
| MIL | 2015 | 34 | 77 | 65 | 80 |
| Average | 48 | 87 | 71 | 86 |
The 2015 Brewers were the only team who were even close to struggling as much as the Tigers but improved to only being 20% below league average. They weren’t alone. In every instance, these early strugglers improved to each being only 14% worse than the league average by the season’s end. Even more interesting is that the widely varied May values average out to the end-of-season values. It’s like the early strugglers were unlucky.
Next, I used 150 data points and determined the normal regression from a small sample to the end-of-season value. For just one month’s of data, the end of season value is 23% of the March/April value and 77% league average (100 with wRC+). Two months later, the season to date amount nearly doubles to 45%. For reference, here is how to project the Tigers’ end-of-season wRC+.
85 wRC+ = (23% * 33 wRC+) + (77% * 100 wRC+)
Once I knew that the Tigers are likely an 85 wRC+ going forward I could see how lefty pitcher performed against similar hitting teams.
I used historical Steamer ERA projections to group the starters into four groups and the teams into six. Then I found the combined ERA, WHIP, and Win percentage chance for each grouping.
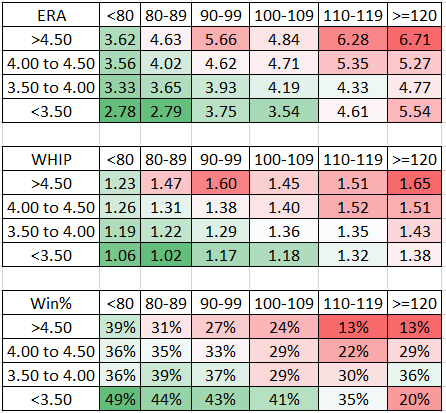
While not smoothed out (see the >4.50 ERA/90-99 grouping), the results make sense. Now, getting back to see if Perez was a reasonable start, he’s projected for 4.77 ERA which puts him in the top row. The Tigers’ 85 wRC+ puts them in the second column. The projection works out to a 4.63 ERA, 1.47 WHIP, and a 31% chance of a Win. The adjusted projections are in line with Perez’s actual projections. For now, it’s tough to see the advantage of chancing Perez.
Jeff, one of the authors of the fantasy baseball guide,The Process, writes for RotoGraphs, The Hardball Times, Rotowire, Baseball America, and BaseballHQ. He has been nominated for two SABR Analytics Research Award for Contemporary Analysis and won it in 2013 in tandem with Bill Petti. He has won four FSWA Awards including on for his Mining the News series. He's won Tout Wars three times, LABR twice, and got his first NFBC Main Event win in 2021. Follow him on Twitter @jeffwzimmerman.
So is the number on the left of the equation supposed to be 84/85 or am I reading it wrong?
You’re right