Machado’s Weird Contact
Manny Machado has been in a slump. That feels like an understatement. Over the past month he’s been one of the weakest hitters in the game, managing only .261 wOBA and 56 wRC+. This value is buoyed by six home runs, which account for 27% of his hits in the month of May. This is one of the worst stretches of his career, if not the worst. Notably, he had a rough patch to begin the 2015 season, but that period only lasted two, perhaps three weeks. It also had a reason, Machado had missed the final 80 games of 2014 while recovering from knee surgery. This year, though. This is different.
There are no obvious signs of problems with Machado. By all accounts his mechanics seem fine and he appears to be healthy. There could be psychological issues at play and many have used the term ‘pressing’ to describe Machado. Unfortunately there is a possibility that the feud with the Red Sox and the resulting beanings and attempted beanings may have played some role in his slump, although that seems like a bit of a stretch. None of these explanations are satisfactory, and they raise more questions than they answer.
Today I’m going to look at this slump in a slightly different manner, and hopefully highlight a few measurements and stats along the way that will spark your imagination. As usual, this piece is less about Manny Machado, and more about approaching baseball from a different perspective.
At A Glance Balls In Play Stats
Machado is hitting the ball as hard as ever. His Value Hit rate is hovering around 10.3-10.5% between 2016 and 2017. In other words, just about 10% of his plate appearances result in a batted ball that is an almost guaranteed extra base hit. This is very good, the league average is 5.7%. His 10.3% rate ranks 18th in the majors among batters with at least 75 balls in play, and 16th among active players, since Mike Trout and Freddie Freeman are both injured. The standard deviation is 3.3%, so his z-score is 1.39.
This is very good, but it shouldn’t be a big surprise given his home run rate this year. He has 10 homers, and he’s on pace for at least 19 more.
On the flip side, his poorly hit rate—near automatic outs—is down. Not by a terrible amount, but enough to be noticeable. It has actually been steadily dropping since 2015. Perhaps 2015 was hampered by his knee injury, perhaps it is an evolving skill. It is hard to tell since the stat isn’t available prior to 2015. Either way, it has fallen from 26.5% to 23.3% to 22.3% respectively over the past three years. This is another great thing to see, although hold onto your pants because I’ll delve deeper into this issue in a moment.
I should note that his strikeout rate has increased this year, which more than offset his decrease in poorly hit rate. You can generally lump the two together, since they are both near guaranteed outs. In this sense, his ‘automatic outs’ per plate appearances has gone up from 40% last year to 44% this year.
Alright, so that’s neat, he’s hitting the ball hard with fewer weakly hit balls. In general, you’d expect an uptick in performance, but we know he’s gone in the other direction. I guess at this point a lot of people give up and claim BABIP. Yes, he has an atrocious BABIP, but we also have more ways to examine quality of contact so let’s dig deeper.
Exit Velocity
Machado’s exit velocity is up by quite a bit, nearly 94 mph from around 90 mph last season. You might look through xStats and notice his HD velocity is up by 10 mph (!!). His flyball velocity is up by 5 mph, too. Both of these should lead to homers, probably. And he’s hit a bunch of homers, so that checks out.
Except there really is a lot more to Exit Velocity than just averages. I think this story is best described using histograms. This first histogram contains both 2015 and 2016 data. Trust me when I say that both 2015 and 2016 each, independently, look roughly the same.


Both of these charts range from 30 to 120 mph along the x axis, so even with different labeling they are on the same scale along that axis.
In 2015 and 2016 you see a multimodal distribution, with one peak around 85 mph, and a few bumps between 90, 100, and 110. The drop in frequency below 80 mph is rapid, but somewhat smooth.
Now compare that to 2017, which appears quite different. Yes, it still has a peak around 82 or so, which might be roughly equivalent to the 85 mph peak from prior seasons. You have a few bumps between 95 and 112 or so, which roughly coincides with what we expect. However, the lower end of these exit velocities, between 30 and 80 mph, are largely missing. This probably explains his drop in poorly hit balls.
We’re Going to Need Launch Angle, Too
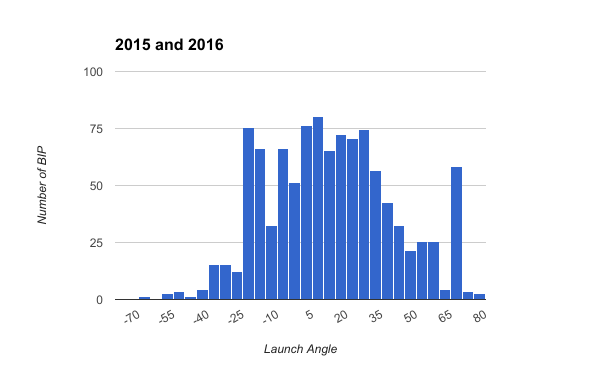
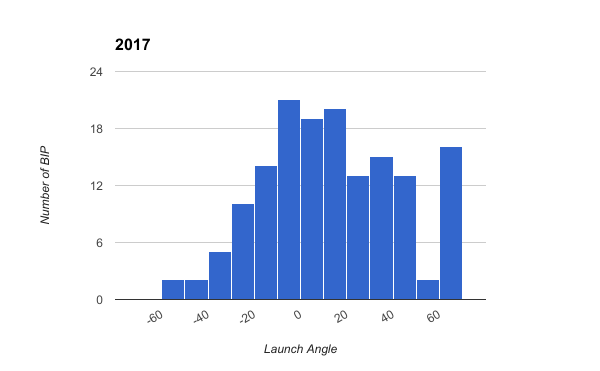
Just like the exit velocity charts, both of these launch angle charts have the same x axis. The labels are different, but they are on the same scale, from -80 to 80 degrees.
There are a few notable features in these charts. In 2015 and 2016 you have spikes in frequency between -25 and -10 degrees. I’m not sure exactly what causes this, it could be inaccuracies in the reported measurement. You also have a sort of dual peak between 5 and 30 degrees, followed by a gradual but somewhat smooth drop off as you increase towards 50 degrees.
In 2017, it is very different. There is a peak around 20 degrees, then a sudden drop between 20 and 30 degrees. The spikes in frequency between -25 and -10 degrees are also entirely missing, which may help explain the decrease in low exit velocities.
Tying it Together
Manny Machado has had a large and uncharacteristic decrease in frequency for launch angles between -25 and -10 degrees and 20 and 30 degrees. As a result, his distribution of exit velocity has become distorted. There appear to be a significant drop in the frequency of both his low value and middle value batted balls, which would likely result in a dramatic reduction in his singles rate. Meanwhile, his high end batted balls appear to have remained constant.
As a result, you see a continued source of in game power, but a large reduction in singles and batting average. This pattern is not consistent with an attempt to hit the ball into the air more often. Or rather, if he were trying to hit the ball into the air, he is clearly failing to do so, judging by the dramatic reduction in batted balls between 20 and 30 degrees. He’s hitting fewer balls into the air, but he has maintained a high exit velocity on these balls and as a result has maintained his high quality contact.
These changes, overall, appear like random variation to me. Perhaps the extreme edges of variation, maybe a worst case scenario. But nothing here seems to suggest Manny Machado has lost any raw skill, or that he is even missing the ball by very much. Rather, his launch angles just happened to have fallen into a weird distribution to start the season. This seems to be statistical variation at its finest.
That said, Machado’s xStats point towards a tinge of bad luck as well. His xStats to date suggest production much closer to his career norms.
| AVG | OBP | SLG | BABIP | wOBA | HR | |
|---|---|---|---|---|---|---|
| xStats | .266 | .340 | .520 | .289 | .364 | 12.5 |
| Actual | .205 | .286 | .405 | .218 | .297 | 10 |
There may be psychological components to what is going on with Machado, I can’t speak to that. Buck Showalter has stated he feels Machado’s slump may be more mental than physical. Several Orioles coaches and other MLB scouts seem to agree with that general sentiment. I’m not an expert on Machado’s mechanics (or any mechanics for that matter), but I don’t see a major problem with my own eyes.
Machado’s plate discipline doesn’t appear to have varied much, although his swinging strike rate has gone up to 12%. Pitchers are throwing him a few more sliders, and he appears to be handling sliders exceptionally poorly, but otherwise his pitch mix appears to be about the same. The pitch location data this year makes me uncomfortable, so I’m not going to look too deeply into that.
What Does A Red Flag Look Like?
As I stated up front, this article isn’t so much about Machado as it is an attempt to offer a different perspective. I’ve quoted two stats, Value Hits and Poor Hits, both of which can be found on xStats.org. I’ve also referred to exit velocity and launch angle histograms, which you can easily create yourself using baseball savant. You can apply this method to any player with very little effort.
I claim to see no red flags with Machado in this case. Rather, it is likely a small sample size problem that will straighten itself out over time. But you may be wondering what a red flag may look like, and how to search for one yourself when looking at a different player.
Note that this sort of analysis requires a decent sample size. You really want to aim for at least 100 balls in play. Having said that, first look for the maximum exit velocity. Has it decreased substantially? Say a batter’s maximum exit velocity was 117 mph, and this year, after 150 BIP, his max is only 108 mph. That would be a red flag.
Next, create a histogram as I have done above, and look at the distribution near the maximum exit velocity. You should see a rapid, but smooth drop in exit velocity. If this drop is spread out over a wide range of velocities, that is a bad sign. For example, Machado in 2015-2016 had a precipitous drop in frequency between 110 and 120 mph. This is about normal. If your batter saw a drop between 95 and 115, that would be worrying. It could point to an injury or mechanical problem that is reducing his bat speed.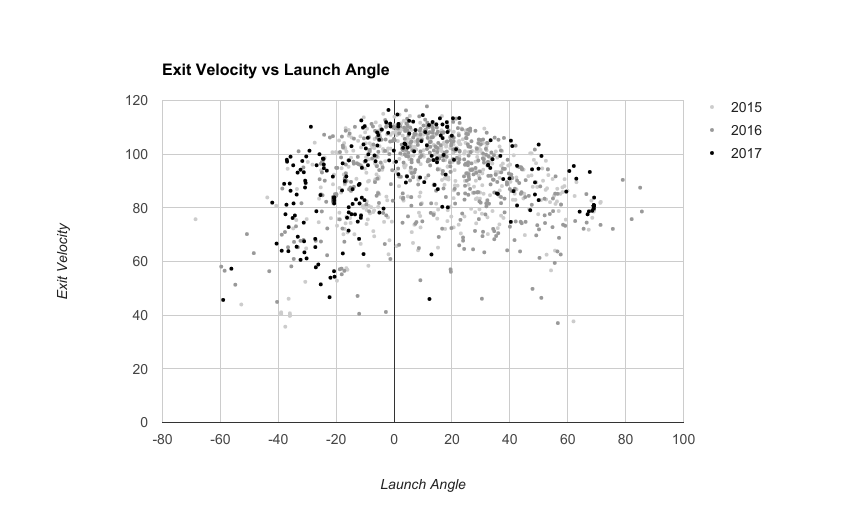
Finally, you may want to plot exit velocity versus launch angle, like you see in the chart above. I have color coded seasons, I hope they are easy enough for you to see. You can see in 2017—the black dots—the distribution is way out of whack when compared to the prior 2015 and 2016 seasons, heavily favoring ground balls. This sort of radical departure can be observed with players, although it might be more common to see it towards the fly ball end of the spectrum. This should always be viewed as a major red flag, regardless of whether it is tending towards fly balls or ground balls.
Andrew Perpetua is the creator of CitiFieldHR.com and xStats.org, and plays around with Statcast data for fun. Follow him on Twitter @AndrewPerpetua.
This is very well done. I especially appreciate how you “show your work”, as it were, by suggesting how other forms of this analysis could proceed. Good stuff.
His LD rate has almost been cut in half. His FB% and GB%. Is it not feasible to think in trying to hit more flyballs he’s mis-hitting the ball in the ground?
Otherwise, as you shown and by leading the league in balls hit over 95 mph, it’s purely bad luck, except he’s never really sustained a slump due to his quality of striking. Bat speed and great bat plane through the zone.
His IFFB is up slightly but over this SSS that could be just a couple pop ups.
Great read. Thanks.
This was such a good article. One of the most interesting I’ve read on either Rotographs or Fangraphs in quite a while. Thanks a lot for this work!
Could there be something going on in Baltimore in general? I was looking at the baseball savant estimated hit values for balls hit over 95 mph between 18 and 25 degrees compared to the actual hit values for the last three years. For both 2015 and 2016 the actual value exceeded the estimated value by over 10%, but this year the estimated value is over 20% higher than the actual values.
I removed Machado’s batted balls to see if he was skewing the data, but it remained constant. Then I compared how Baltimore performs on the road, but it also remained constant.
I also checked this year against only April and May from 2015 and 2016. That didn’t make any difference, there is still a major drop in the expected outcomes versus the actual outcomes.
Since these are all generally well hit balls in the air, I wouldn’t think defense has much to do with it. So I’m at a loss to why there has been such a change. How has Baltimore suddenly become a pitchers park? Climate change?
I will mention that this has happened before in Baltimore towards the end of 2015, but not for two months and not this drastically.
Two points, first off while MLB and xStats use similar methodology, they are implemented in totally different ways. Written by different people, in different languages at different times (mine was first, by two years :P). So they may not have the same results all the time.
Second, I just quickly called up the percent launch angle and percent exit velocity for a few 10mph and 10 degree buckets in Baltimore by season. I do not see any irregularities in that. The higher exit velocities are steadily climbing, but not by huge amounts. The launch angles appear to be very stable. So from this alone, I’m not sure I see any systemic issues.
How MLB may be calculating their stuff, I don’t know, but if the baseline data is okay, and that appears to be the case, then I can’t really think of a reason my probabilities would change, either.
I looked at the team xOBA minus the wOBA from the base 2017 tab on xstats (I realize that this will contain road games, but you haven’t published those splits;)). Baltimore (#4), Toronto (#7) and Boston (#9) are the only teams in the top 10 under achievers in hitters parks.
I’d also like to compare this for 2015 and 2016 to see if 2017 is an outlier.
Anyway, it just seems to me that something is going on in Baltimore. I was looking at that specific bucket because I figured it would mostly neglect the influence of defenses. Though it does seem, to me, overall that hitters in Baltimore have been having a longer and worse than normal run of luck.
Thanks for checking it out for me, and thanks for your work.
Oh and I’d like to add two more points:
A: these predictive stats, especially the ones from MLB which I do not believe involves any corrections for temperature, will vary across the season. In spring and autumn it will over estimate production, and in summer it will under estimate. I have worked to reduce this as much as I can, and I still have more work to do, but it is a *lot* better this year than it was last year.
B: I calculated the difference between xStats and actual stats in Baltimore over the past three seasons.
AVG: 1.005, 1.178, 1.062
SLG: 1.049, 1.068, 1.208
BABIP: 1.028, 1.033, 1.066
wOBA: 0.985, 1.001, 1.065
So, there might be a systemic bias for the stadium that should be corrected in park effects, maybe. The numbers appear to be a few percentage points too high across the board, especially in slugging.
And yes, the temperature effects still seem to be evident, although they are reduced a lot from where they were even last season. That’s a work in progress, but I’m happy with the improvements so far. Last year the difference would have probably been two or three times as large.
However, you’re saying the difference with the MLB stats are 20% too high? Well, I guess my slugging it 20% too high, too. But my other stats are closer to 6%. Although 6% is still too high, the park adjustments appear to be too aggressive.
Thanks for digging into the data, I don’t get to talk to many people about this stuff to compare what I’m seeing to check if I’m missing something.
I did check against only April and May and I was seeing 2017 as an outlier, though I don’t know what the weather was actually like during those months.
That slugging in 2017 matches what I’m seeing and it really stands out. That’s why I figure something interesting is happening in Baltimore.
I asked around and indeed something did happen to the radar in Baltimore, but it has been fixed.
Does that mean all the statcast data for the first month plus should be ignored?
Is that something they’ll be able to correct on baseball savant?
Thanks for getting to the bottom of that.
I’m not sure exactly what to make of it. It was described to me as ‘not ideal’. As opposed to ‘wrong’ or ‘broken’. This isn’t a problem MLB or savant could address, no.