Lessons Learned: Season in Review
Ken Blaze-Imagn Images
This past season was one of my worst ever. And about halfway through it, the outcome looked worse than the final results. I was able to focus on a few leagues and salvaged my bankroll. Here are some of the lessons I learned.
Power Outage
While I knew my home run totals were down after examining my standings over six months, I’d always recommend doing the following league comparison to find overall trends.
| League | Finish | R | HR | RBI | SB | AVG | Bat Points | K | W | S/H | ERA | WHIP | Pitch Points |
|---|---|---|---|---|---|---|---|---|---|---|---|---|---|
| LABR | 9th | 4 | 2 | 5 | 3 | 5 | 19 | 4 | 4 | 9.5 | 4 | 2 | 23.5 |
| RTSports | 4th | 7 | 8 | 10 | 1 | 7 | 33 | 10 | 10 | 8 | 8 | 8 | 44 |
| RTSports | 2nd (4th in overall) | 11 | 10 | 12 | 6 | 9 | 48 | 12 | 10 | 11 | 11 | 9 | 53 |
| NFBC 50 | 5th | 8 | 1 | 8 | 10.5 | 7 | 34.5 | 9 | 9.5 | 3.5 | 8 | 8 | 38 |
| NFBC OC | 2nd | 11 | 12 | 12 | 6 | 5 | 46 | 10 | 5 | 9 | 5 | 6 | 35 |
| NFBC Super | 7th | 7 | 4 | 5 | 11 | 3 | 30 | 6 | 3 | 11 | 7 | 8 | 35 |
| NFBC OC | 3rd | 7 | 7 | 11 | 11 | 5 | 41 | 11 | 6 | 8.5 | 6 | 7 | 38.5 |
| Average | 7.9 | 6.3 | 9.0 | 6.9 | 5.9 | 35.9 | 8.9 | 6.8 | 8.6 | 7.0 | 6.9 | 38.1 |
| League | Finish | R | HR | RBI | SB | AVG | Bat Points | K | W | S/H | ERA | WHIP | Pitch Points |
|---|---|---|---|---|---|---|---|---|---|---|---|---|---|
| ToutWars | 9th | 11 | 9 | 9 | 11 | 5 | 45 | 8 | 3 | 7 | 1 | 13 | 32 |
| FT DC | 4th | 4 | 2 | 6 | 12.5 | 13 | 37.5 | 13 | 12 | 13 | 10 | 7 | 55 |
| FT DC | 11th | 5 | 1 | 5 | 5.5 | 8 | 24.5 | 13 | 13 | 7 | 11 | 4 | 48 |
| FT DC | 11th | 7 | 6 | 6 | 3 | 5 | 27 | 11 | 7 | 10 | 9 | 5 | 42 |
| NFBC DC | 4th | 13 | 7 | 9 | 14 | 12 | 55 | 15 | 12.5 | 4 | 4 | 3 | 38.5 |
| NFBC ME | 2nd | 5 | 8.5 | 15 | 6 | 9 | 43.5 | 10 | 14 | 15 | 15 | 15 | 69 |
| TGFBI | 2nd | 13 | 4 | 9 | 12 | 13 | 51 | 14 | 13 | 12.5 | 13 | 5 | 57.5 |
| NFBC Super | 1st (T) | 12 | 3 | 10 | 7.5 | 11 | 43.5 | 14 | 9 | 14 | 13 | 12 | 62 |
| NFBC AC | 6th | 7 | 2 | 8 | 6 | 5 | 28 | 15 | 4 | 14 | 13 | 14 | 60 |
| NFBC AC | 12th | 10 | 5 | 7.5 | 3.5 | 7 | 33 | 4 | 1 | 10 | 7 | 4 | 26 |
| NFBC Super | 12th | 12 | 10 | 9.5 | 1 | 12 | 44.5 | 4 | 1 | 14 | 5 | 2 | 26 |
| NFBC ME | 15th | 1 | 1 | 3 | 2 | 9 | 16 | 3 | 1 | 8 | 6 | 8 | 26 |
| Average | 8.3 | 4.9 | 8.1 | 7.0 | 9.1 | 37.4 | 10.3 | 7.5 | 10.7 | 8.9 | 7.7 | 45.2 |
Holy lack of home runs. I didn’t put enough emphasis on home runs during the draft, and it was obvious across my standings.
In the leagues, I posted a decent home run total … I performed better.
While in the 12’s, the pitching and hitting were close (2.2 points), there was a huge gap in the 15’s (7.8 points). I know Michael Harris II can take a lot of the blame for some team underperforming, but I need to overweight home runs when I create my draft rankings for 2026.
Making up SHOLDS
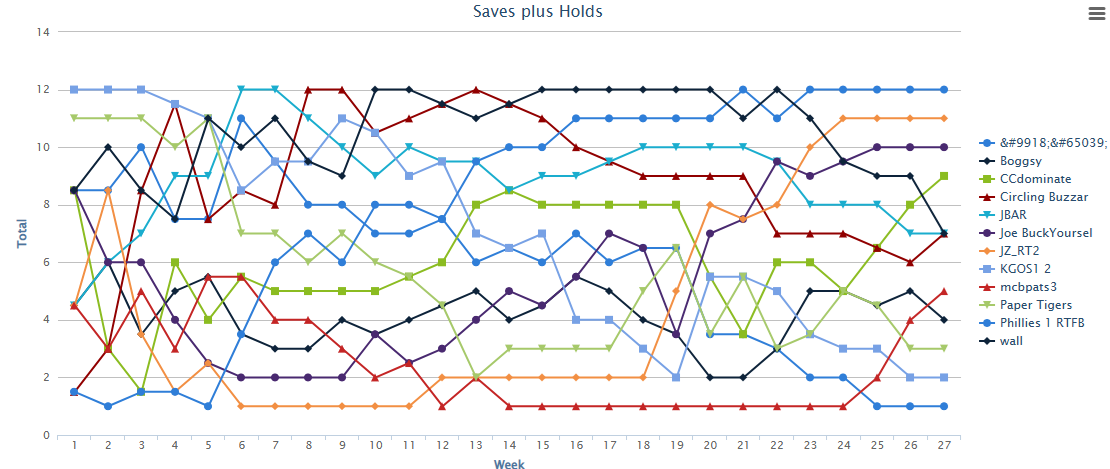
At RTSports (2nd-place team), I drafted an elite starting pitcher staff including Famber Valdez, Logan Webb, Freddy Peralta, Cristopher Sánchez, Nick Pivetta, MacKenzie Gore, and Matthew Boyd (misses were Roki Sasaki, Yusei Kikuchi, and Tomoyuki Sugano. Additionally, I added Quinn Priester right when he got hot. There were weeks I could roll out eight solid starters.
The league is Saves plus Holds (SHOLDS), so usually three to four relievers are started because the right ones can be five-category contributors. I kept running out healthy starters, and fell into last place in SHOLDS. At about the halfway point, I needed to make a move and began starting five relievers.
For the relievers, I focused on guys with the combination of:
- High strikeout rate: Need the strikeouts with so few starters.
- High leverage usage: Needed for Wins and SHOLDS. Of the categories, this one was the most important to check on. Sometimes there were no high-leverage opportunities. Other times, someone else has moved into the high-leverage role.
- Good teams: Needed the Wins.
- Weekend usage: Tried starting guys who were rested going into the week (didn’t throw on Saturday and/or Sunday).
I wasn’t looking for SHOLDS leaders; I aimed for multiple categories contributors since I needed to sit my starters. Here are some of the guys I leaned on:
| Name | IP | W | SV | HLD | K/9 | SO | ERA | WHIP |
|---|---|---|---|---|---|---|---|---|
| Gabe Speier | 62 | 4 | 0 | 24 | 11.9 | 82 | 2.61 | 0.87 |
| Adrian Morejon | 73 | 13 | 3 | 20 | 8.6 | 70 | 2.08 | 0.90 |
| Garrett Whitlock | 72 | 7 | 1 | 24 | 11.4 | 91 | 2.25 | 1.08 |
| Jeremiah Estrada | 73 | 4 | 3 | 30 | 13.3 | 108 | 3.45 | 1.16 |
| Matt Brash | 47 | 1 | 4 | 21 | 11.0 | 58 | 2.47 | 1.25 |
It took a while to get off the bottom two (JZ_RT2), but my SHOLDS ended up second in the league and in the 73rd percentile in the overall competition.
While not an ideal process, SHOLDS can be made up in a couple of months with players who contribute in all five categories.
Waiting on Starters was full of landmines
I’m not a fan of investing in the aces as much as grabbing five from rounds six to 10. I’m not relying on one or two guys staying healthy and productive, but five. Well, the five-starter plan can even get decimated.
I had several teams go this way with multiple starters on the IL and out for the season. Here is a list of some of the top drafted starters who had their season cut short by injuries. It doesn’t even include those top picks who struggled (e.g., Dylan Cease and Bailey Ober).
Name: NFBC ADP
Corbin Burnes: 40
Pablo López: 75
George Kirby: 83
Spencer Schwellenbach: 91
Aaron Nola: 95
Tyler Glasnow: 100
Roki Sasaki: 102
Hunter Greene: 103
Justin Steele: 131
This season, a majority of the aces stayed healthy, while starters going in the late single-digit rounds headed to the IL.
Here are the guys I added in my 12-team LABR league (auction)
- Chris Sale
- Pablo López
- Aaron Nola
- Justin Steele
- Ranger Suárez
- Ryan Walker
- Ryan Helsley
- Grant Holmes
- Shane Bieber (IL slot add)
This staff ended up the worst among my 12-team leagues. Because of the lack of options, I ran into another problem …
Limit Spending
In this league, we are limited to $100 FAAB with no $0 bids. This budget allows for about four moves per week (26 weeks x $4) at a single dollar. Historically, I’ve allocated $2 per week for streaming moves and $50 to make major improvements. As the team fell apart, I needed more than the two moves per week I was allocated, but I didn’t have the money after a couple of early high-dollar adds.
In the future, I plan to make just $1 bids and then use the leftover FAAB for fun money. In this 12-team league, the ability to make moves and avoid zeros is more important than taking a chance on a rookie.
Late Standings Jump
In one of my twelve-team leagues, I was in 8th place and 21 points out of finishing in the money on September 7th. The distance and the traffic seemed too large to make up, so I didn’t nitpick every point in the league. I maintained a healthy roster and started my best players. Then, over the next three weeks, I saw the following standings jumps.
Date: My move, 2nd Place move ($$ slot)
Sept 14th: +3, -4.5
Sept: 21st: +8, -6.5
While I passed the guy who was in second, a couple of the other managers stayed ahead of me, but I was just 3.5 points out of second going into the last week. At some points during the week, I slid into second but ended up 3 points out of second place. I know I could have fielded a better team
Two takeaways got from this league are:
Magic moves can happen in the standings, so don’t give up and …
Too Many Teams
I managed too many teams to give each one the attention needed to compete. I like having multiple teams in case one or two fall apart, but 14 FAAB leagues were too many. At this point, I plan on cutting four and going down to:
- LABR
- Tout Wars
- NFBC CLQ Bundle (two FAAB leagues)
- One NFBC Auction Championship League
- Two NFBC Supers
- Two RTSports Leagues
- One NFBC Online Championship
No more 15-team, 50-round DCs
If I draft any Draft-and-Hold leagues (I have to draft one in the CLQ package), I want to limit myself to the NFBC 50’s (12 teams, 50 rounds). From some research I’ve done, the last 150 players don’t matter in redraft leagues, and I should focus on the guys going in the smaller drafts.
Also, the “slow” drafts get done days faster with fewer picks.
After a trying season, a little luck was nice
In the one first-place team, I was in striking distance but never leading at the season’s halfway point.
May 25th: 31 points out of first, 6th place
June 29th: 29 points out of first, 6th place
Even in my best teams, I was struggling. I made a nice run, and three teams all had a shot at winning the $20K first prize going into the last few weeks ($8K and $6K for 2nd and 3rd place).
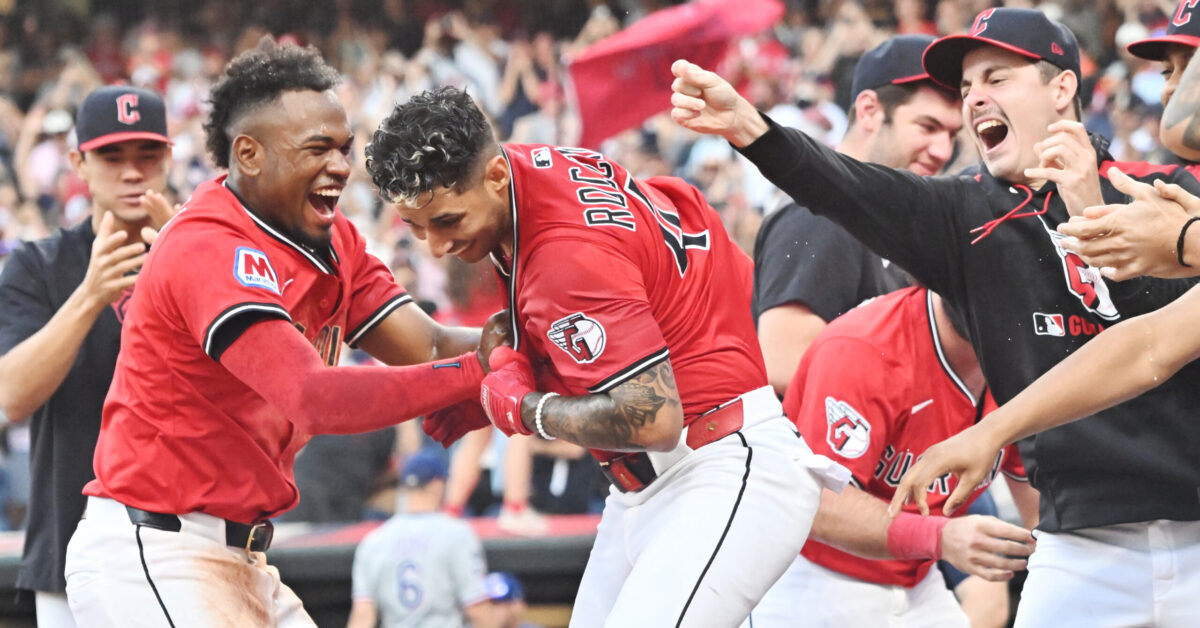
I started Sunday, 1.5 points out of first. I got to within a half a point with only the Guardians-Rangers extra innings game left. The other team had no more active players, while I still had Brayan Rocchio and Steven Kwan going. A Run or Stolen Base moved me into a tie, a Run and a Stolen Base means an outright. I got the Run as Rocchio ended the day with this blast.
Brayan Rocchio hits a walk-off three-run home run (5) in the tenth inning as the Cleveland Guardians rallied to defeat the Texas Rangers 9-8 at Progressive Field in Cleveland.#GuardsBall
pic.twitter.com/Ox3Doed2Ak— Rockford Maverick (@RockfordMav) September 29, 2025
It’s tough to beat a $6K swing in prize money on the last play of the regular season.
Jeff, one of the authors of the fantasy baseball guide,The Process, writes for RotoGraphs, The Hardball Times, Rotowire, Baseball America, and BaseballHQ. He has been nominated for two SABR Analytics Research Award for Contemporary Analysis and won it in 2013 in tandem with Bill Petti. He has won four FSWA Awards including on for his Mining the News series. He's won Tout Wars three times, LABR twice, and got his first NFBC Main Event win in 2021. Follow him on Twitter @jeffwzimmerman.
Wow, congrats on the Rocchio home run and thanks for all your content this season. I, too, had my worst season ever, finishing at or near the bottom in batting average in every league. Any idea if there was more batting average variance this season than in years past in terms of more players than normal underperforming their projections?