Kodai Senga: Ottoneu P/IP Faller
Last week, I wrote about Mike Burrows, as he was the single largest gainer in Ottoneu FanGraphs points per IP between the first and second halves of the season, among pitchers with at least 30 IP as a starter in both halves. Today, I wanted to look at that same list and cover the pitcher who was the single largest faller among that same population. Except, I am not going to.
See, the single largest faller is German Marquez, who put up an abysmal -1.79 P/IP in the second half. But his first half was only 2.89 P/IP. He hasn’t been over 4 P/IP since 2021. There just isn’t much to discuss there. So instead, we will take the second biggest faller: Kodai Senga.
Kodai Senga – Lost 3.78 P/IP, from 5.52 to 1.74
Senga’s fall was so rough that he accepted an option to triple-A in September, where he made two starts, going 9.2 total IP allowing 5 ER on 9 H and 2 BB with 12 K. He also hit a batter, but did not give up any HR.
But I am less interested in looking at those two starts – a pitcher with his experience and skill was likely working on specific things in triple-A, so it is hard to interpret the overall lines – than I am in figuring out how he fell so far and what that might mean for the future.
Right from the start, you can quickly see some concerning trends in his strike out and walk rates.
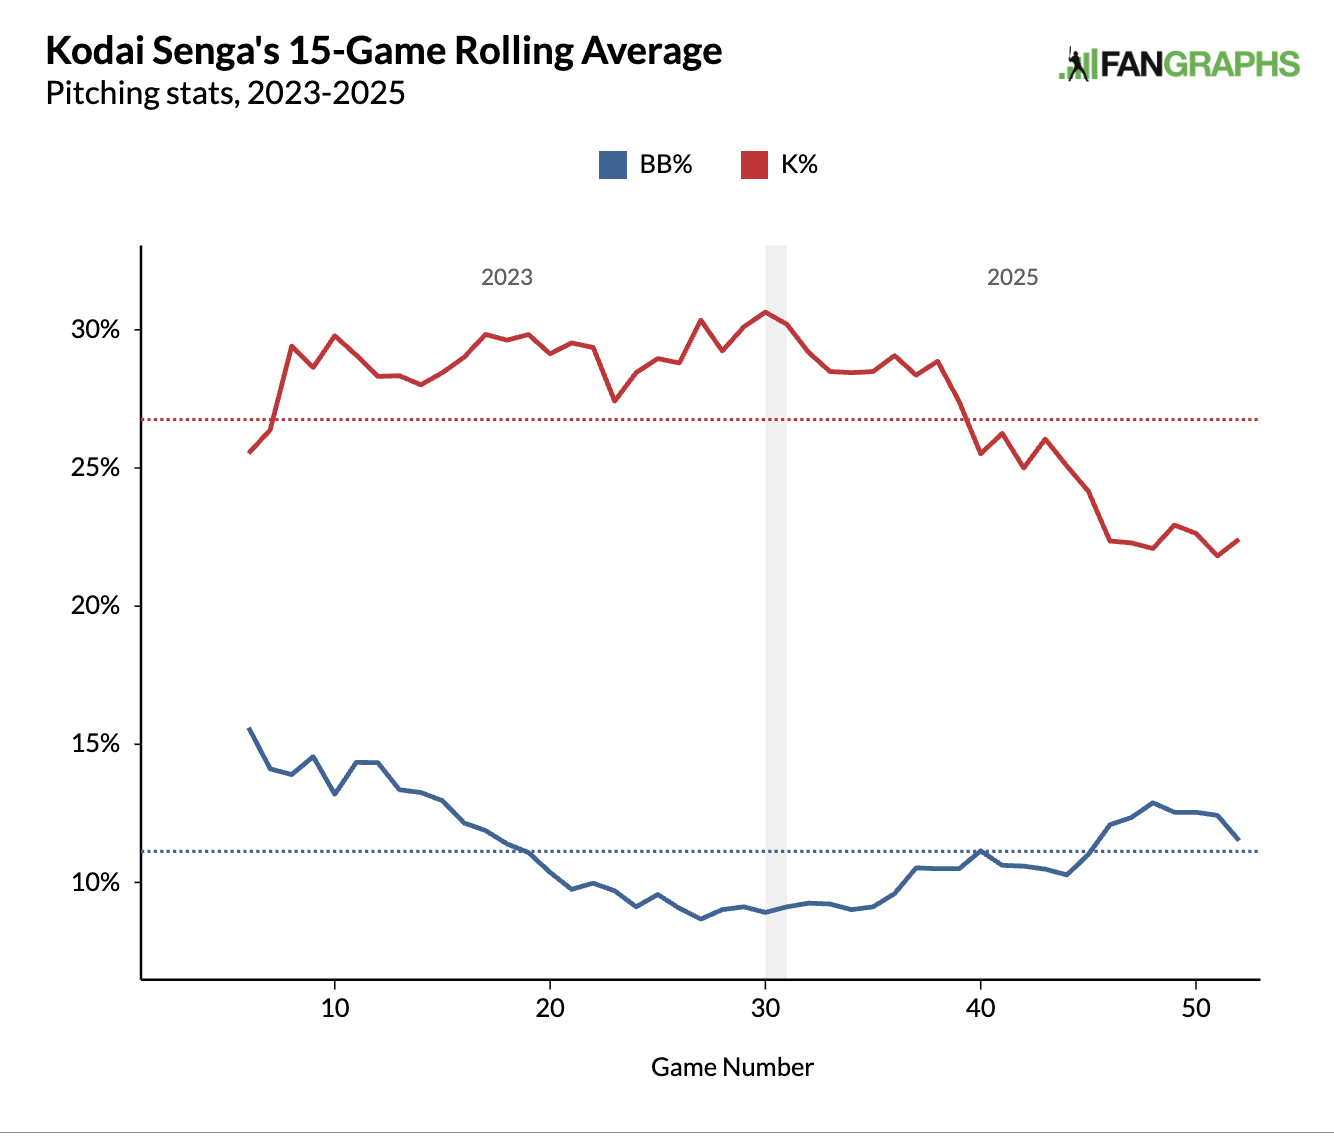
Over the 2023 season, Senga maintained his K% while bringing down his walk rate. After missing 2024, you might have expected him to come back with control issue, but instead he started 2025 with some of the best control he had shown and strong K-rates. But both of those things moved the wrong direction as the season went on.
You might expect to see a big drop in zone percent or a big drop in chase rate, but that isn’t exactly what happened.
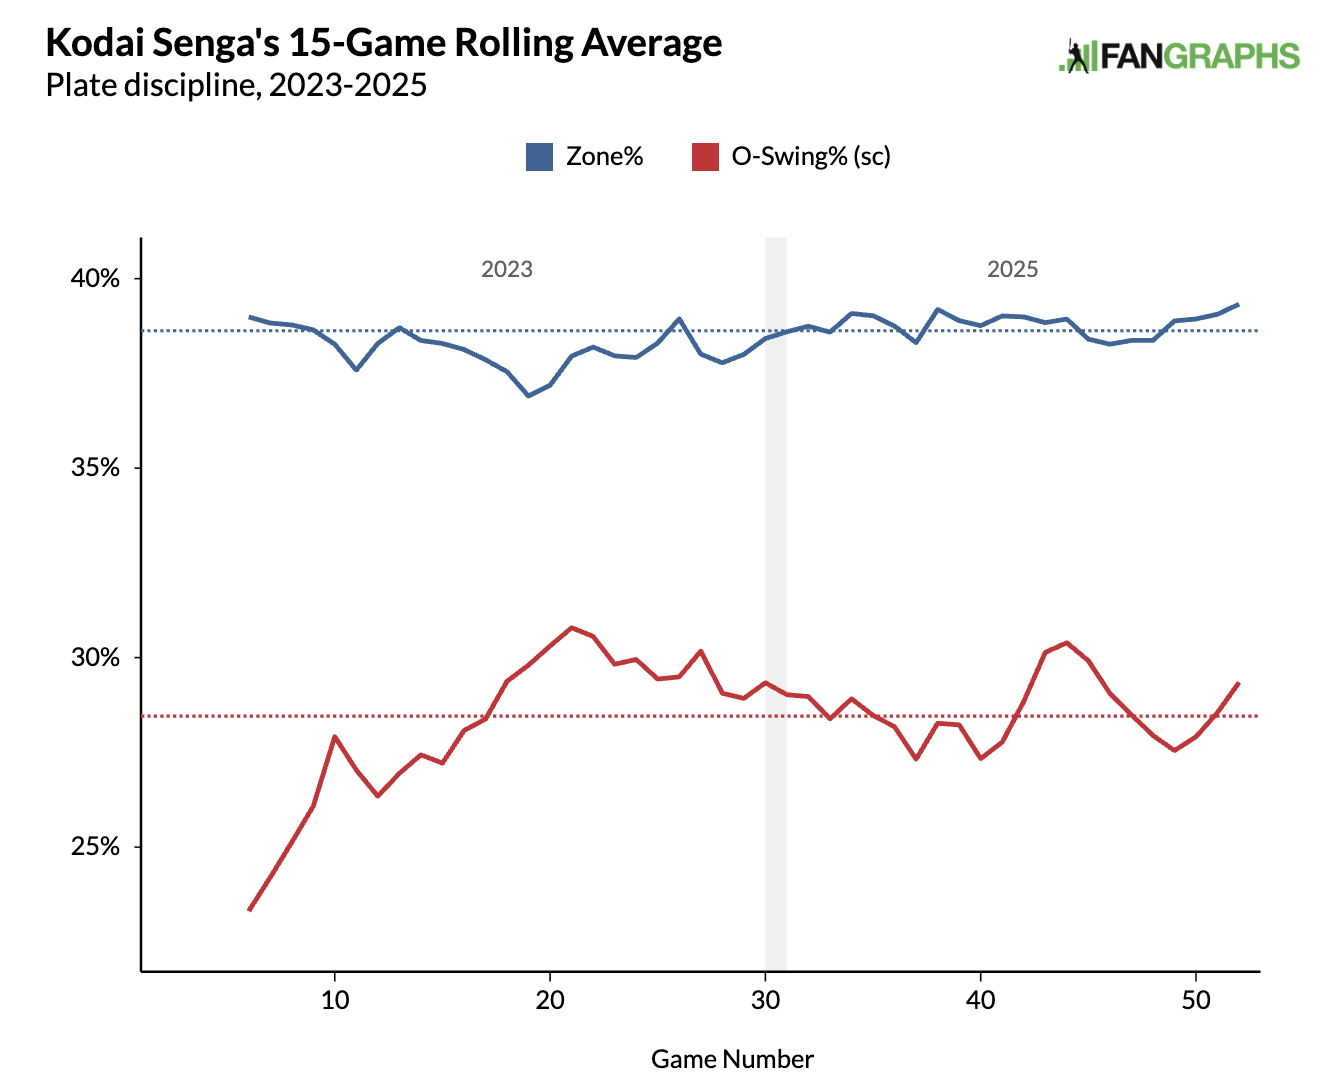
If anything, his O-swing% and zone% both ended the season a bit up, rather than down, and his overall numbers for 2023 vs. 2025 reflect the steadiness of the graphs.
| Season | O-Swing% | Z-Swing% | Swing% | O-Contact% | Z-Contact% | Contact% | Zone% | F-Strike% | SwStr% | CStr% | CSW% |
|---|---|---|---|---|---|---|---|---|---|---|---|
| 2023 | 28.2% | 65.7% | 45.0% | 48.8% | 84.4% | 72.2% | 44.9% | 56.9% | 12.5% | 15.5% | 28.0% |
| 2025 | 28.7% | 65.0% | 45.4% | 51.0% | 86.8% | 74.5% | 45.8% | 55.4% | 11.6% | 14.7% | 26.4% |
You don’t see big changes in swing rates or zone rate. Yes, there is a drop in first strikes, but not a ton. The big change is in contact rates. Both in and out of the zone, batters were just more likely to make contact, leading to fewer swinging strikes.
There is also a drop in called strikes that is a little harder to understand. If Senga was throwing more pitches in the zone (0.9% more) and hitters were swinging slightly less at those pitches (0.7% less), you would expect a few more called strikes. But they aren’t showing up.
Basically, you get a picture of hitters who are just seeing his pitches better or are otherwise less fooled by his pitches. If that were true, you might expect to see a jump in hard contact. And you do.
Kind of. Again, things are a little hard to parse. His hard-hit rate went from 40.5% in 2023 to 40.3% in 2025, but his barrel rate increased from 6.8% to 7.9%.
That increase is even more dramatic if you look at what happened within the 2025 season:
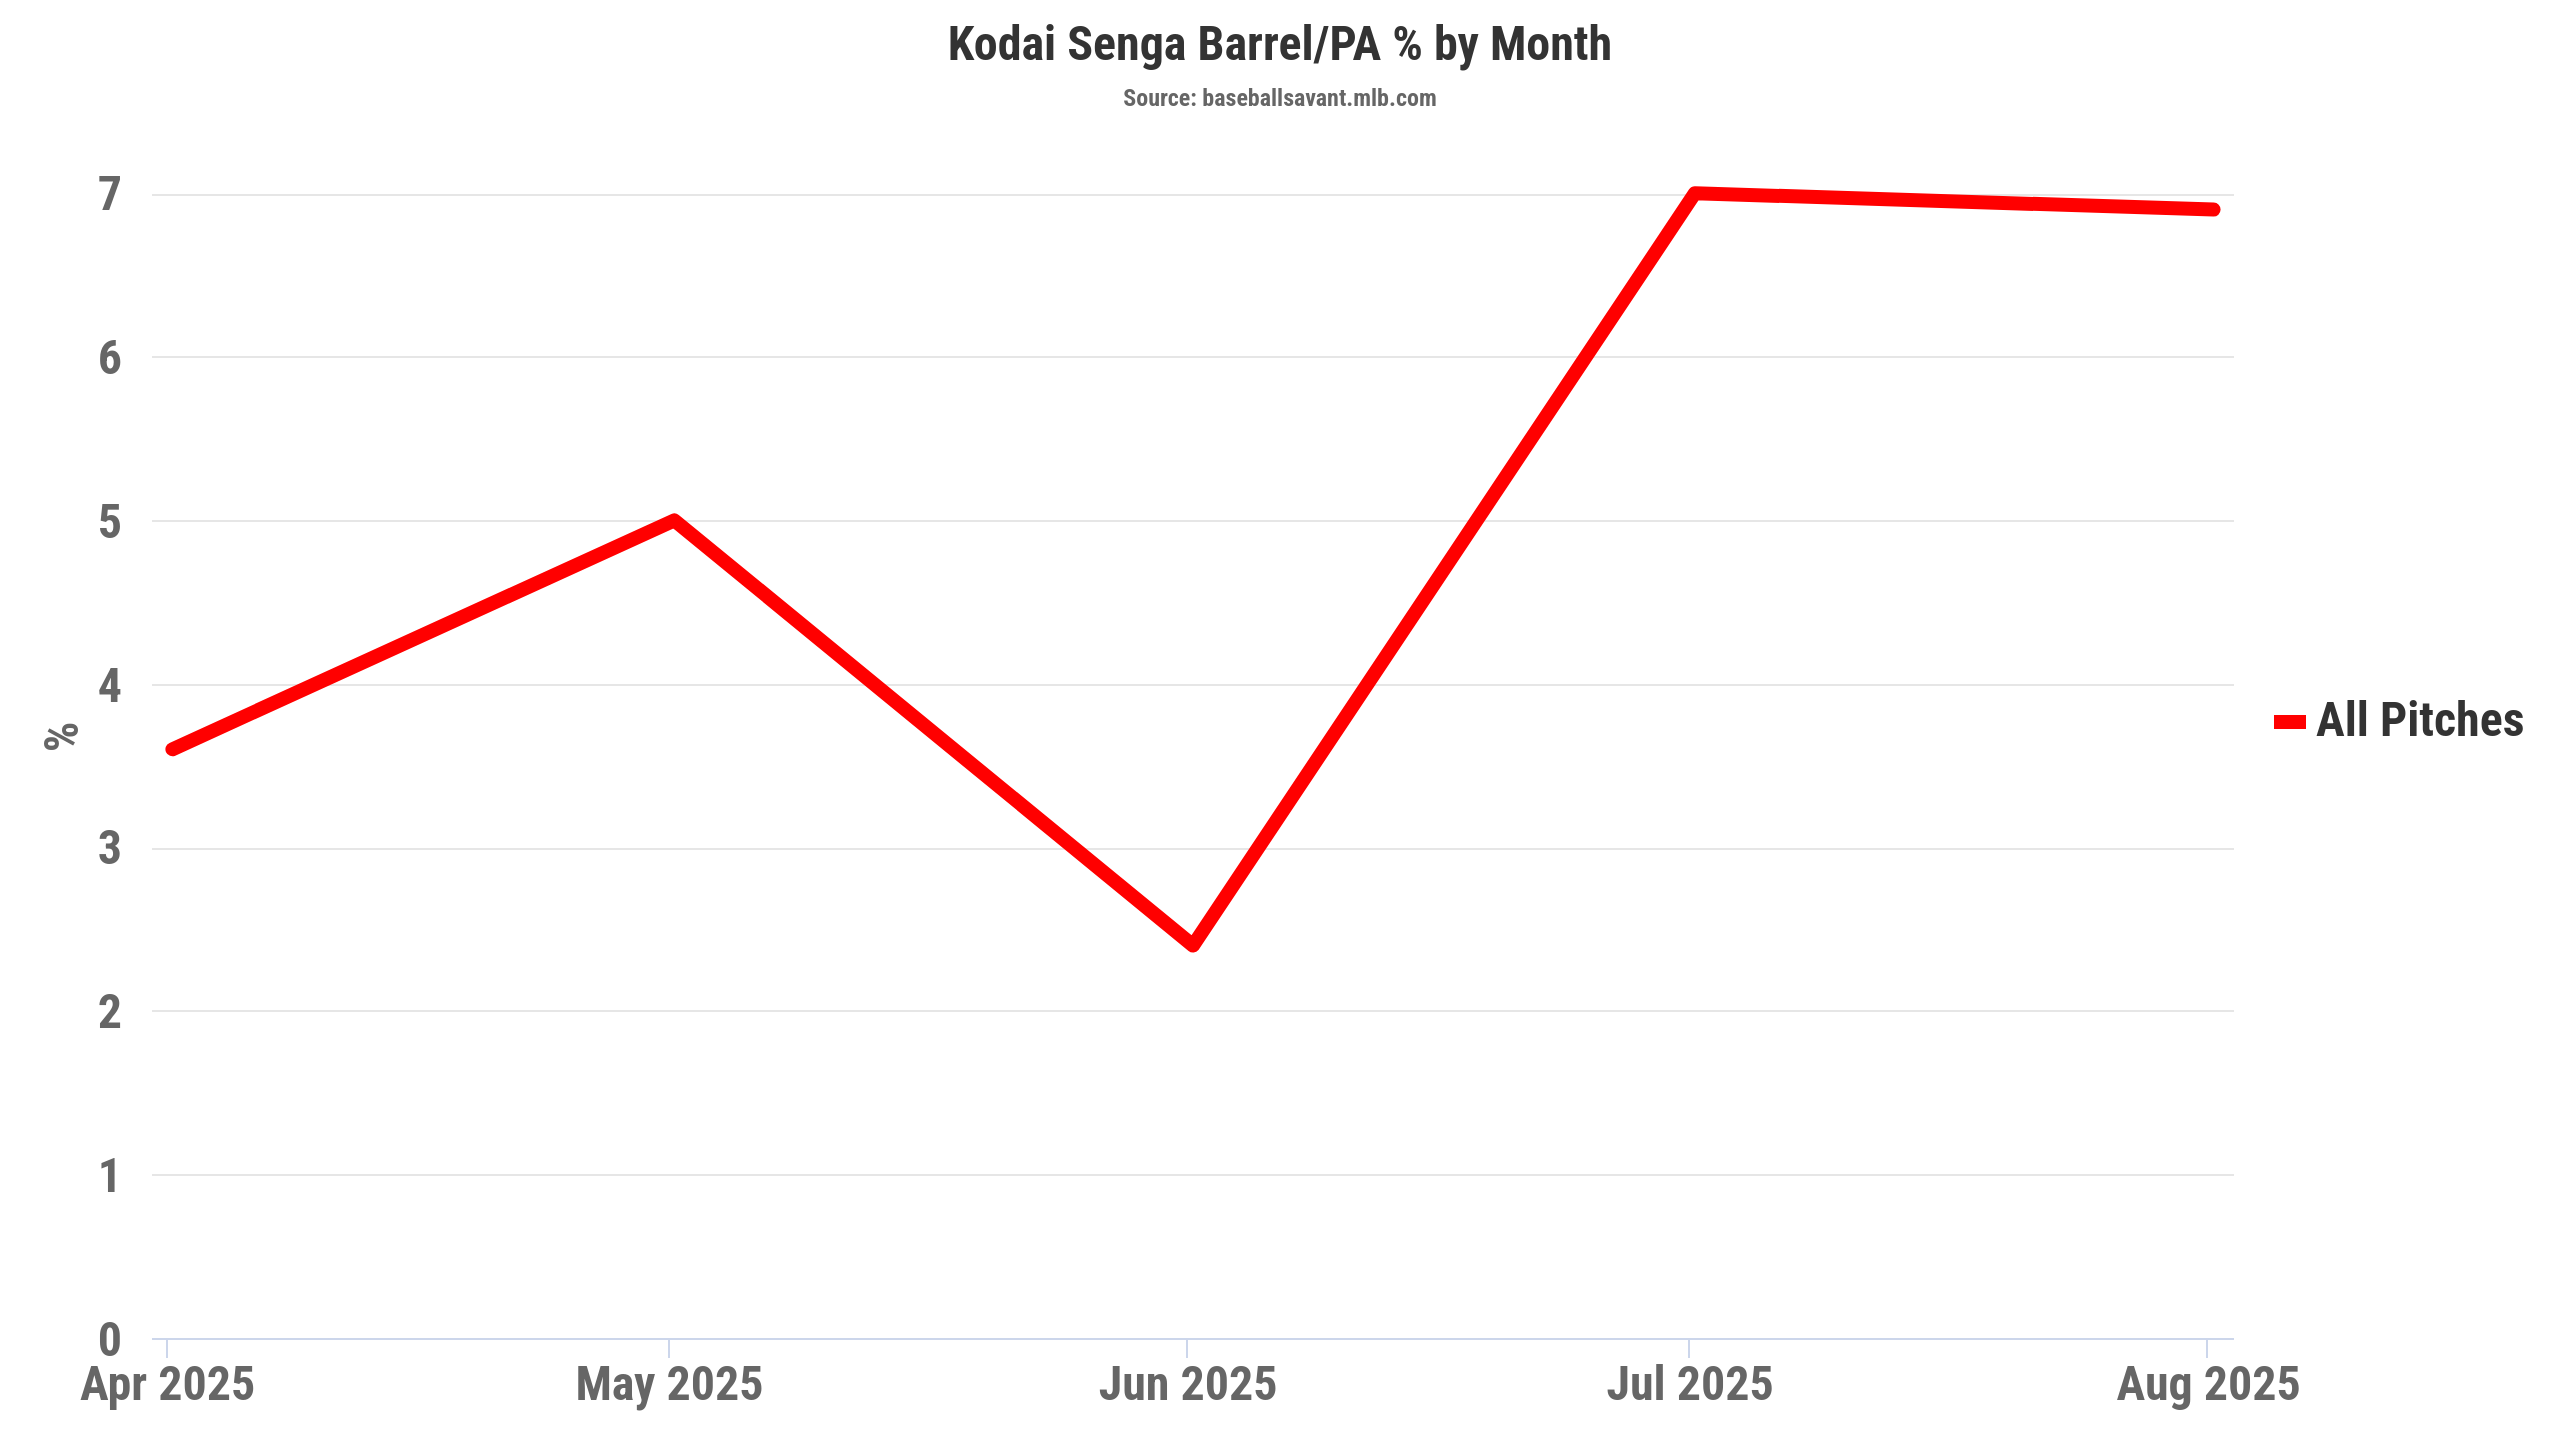
Through June, Senga’s barrel rate was lower than it had been in 2023. In July and August, it shot up.
That sudden uptick in barrels – and the resulting drop in production – aligned with a few other things:
- His walk rate jumped from 10.6% through June to 12.9% after.
- His K-rate fell from 23.8% to 20.5%.
- His line drive rate went from 13.4% to 19.3%.
- His HR/FB rate went from 5.1% to 20.5%.
- Opponents pulled the ball 47.3% in the second half, up from 40.9% in the first.
All of that suggests what I mentioned before – hitters were seeing his pitches better, timing him up better, and teeing off as a result.
What drove that? While, the obvious thing to note is that he strained his hamstring in mid-June and missed a few weeks. And he clearly never felt right again after that. He told Anthony DiComo of MLB.com that his struggles all “come down to my body.”
There is some lost velocity that could be explained by lingering injury or mechanical issues, but there isn’t anything obvious in his pitch shape or his Stuff+ to suggest that his pitches were less effective. His location+, however, did drop quite a bit, going from 97 in the first half to 92 in the second.
You can see this for yourself in this comparison of first and second half heat maps of his breaking pitches – his slider and his curve, specifically.
In the first half, he is buring those pitches down and away from righties. The ONLY red zone is nearly 6% of those pitches being all the way in the bottom right corner. In the second half, you see some red bottom center. But even more problematically, you see some red creeping in middle-middle. In the first half, you also see some blue up and in to righties (or away to lefties) in a spot you might try to throw a breaker for a strike. That space is less busy in the second half.
He doesn’t throw those pitches a ton – under 15% of the time combined – but they went from basically neutral pitches by run value in the first half to pretty negative in the second. And that may have pulled down the others, as well. If he can’t locate the breakers where he wants to, everything else is easier to let go or time up.
What does that mean for 2026? I am intrigued to see what Senga looks like in March, but my best bet right now is that when he says this is about his body, he is right. Having an off-season to fully recover from his injury and get his mechanics back where they belong will probably allow him to go back to locating his pitches better.
Having said that, there is a lot of risk here. His stuff+ didn’t take a step back from the first half to the second, but it DID take a big step back from 2023 (101 overall) to 2025 (94 overall). That puts a lot more pressure on his ability to locate his pitches well. And you can see that in the splits – he put up 5.52 P/IP when he was locating decently. He put up 1.74 when he wasn’t.
Even if he is better able to locate his pitches in 2026, if his stuff doesn’t get better, his ceiling is a lot lower. A 101 Stuff+ is similar to Freddy Peralta, Tanner Bibee, or Jesus Luzardo (all 102, no one qualified for the ERA title was exactly 101 this year). A 94 Stuff+ is similar to Jake Irvin, Matthew Boyd, Jeffrey Springs, or Andre Pallante. Springs, at 98, had the worst Location+ of that quartet. The stronger version of Senga, in the first half, was only a 97.
Eno Sarris would tell me that as a pitchers career gets more defined, Stuff+ is less telling. But it can be a leading indicator, and it’s a concerning one for Senga.
A long-time fantasy baseball veteran and one of the creators of ottoneu, Chad Young's writes for RotoGraphs, and can be heard on the Keep or Kut Podcast. You can follow him on Bluesky @chadyoung.bsky.social.
Any chance he was tipping his pitches?