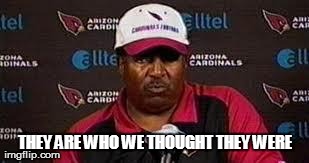
Jay Bruce: He Is Who You Think He Is
Jay Bruce has had a three year stretch of significant consistency. Check out the chart below showing the lack of variance.
| Season | G | PA | HR | R | RBI | AVG | wOBA | wRC+ |
|---|---|---|---|---|---|---|---|---|
| 2011 | 157 | 664 | 32 | 84 | 97 | 0.256 | 0.349 | 119 |
| 2012 | 155 | 633 | 34 | 89 | 99 | 0.252 | 0.352 | 120 |
| 2013 | 160 | 697 | 30 | 89 | 109 | 0.262 | 0.344 | 117 |
The results have been similar, but the way Bruce has gotten there has been a little different.
The first thing that stands out when you take a look at the underlying numbers is some variance in his line drive rate. In the last three years it has gone from 16.8% to 20.2% to 23.9%. This shouldn’t be a surprise given that we know line drive rate is a highly variable statistic. But it is surprising that it has been so variable and yet his results have not.
Line drive rate tends to have an impact on batting average. We all know that line drives go for hits far more often than do ground balls and fly balls, and yet there is little difference in Bruce’s most recent batting averages. The reason is that Bruce has not paired his best line drive rates with his best contact rates. Bruce’s contact rate was a little above 74% in 2011 and 2012, but it fell to 70.3% last year when his line drive rate was at its peak. The long and short of it is that Bruce has yet to pair good contact with frequent contact.
If Bruce could find a way to do so, he’d be in line for a big batting average jump. But it’s unlikely to happen given the variance in line drive rate. The most likely outcome is that Bruce’s line drive rate will be somewhere near his career mark of 19.5%. And I wouldn’t expect his contact rate to bounce all the way back. As the graphs below will show, Bruce struggled to make contact on offspeed pitches and against right-handed pitching last year. And as the zone charts below will show, pitchers are aware of this weakness and have exploited it.
The other thing that the variance in line drive rate affects is Bruce’s home run totals. Despite having a similar average home run and fly ball batted ball distance in 2012 and 2013, Bruce hit four fewer home runs this year in part because he hit fewer fly balls as a result of hitting more line drives. If the line drive rate regresses as expected, it might actually be a good thing for Bruce’s home run total.
The best case scenario for his 2014 season is more fly balls (meaning more homers) and more contact (meaning his batting average holds steady). But I think the most likely scenario is that he hits a few more homers and the average slips, which sort of comes out to a wash.
The real question is whether a similar level of production will be worth Bruce’s price on draft day. And because his production has been so consistent, we have a pretty good idea of what that price will be. His median draft position across all the major sites the last two years was 36 in 2013 and 39 in 2012. Because his power dipped a little last year, he could fall into the 40’s this year. Below is a list of all the players with a median draft position in the 40’s for the last two years and their rank at season’s end on ESPN’s player rater.
The main reason I’ve included that chart is to show that once we hit the 40’s (aka the third or fourth round), we’re well into potential bust territory. It’s anything but guaranteed that you’re going to get a dependable player at that point in the draft. And given Bruce’s consistent production, he’s well worth a pick in that range.
Thanks to Dennis Green for inspiring the title for this article.
You can find more of Brett's work on TheFantasyFix.com or follow him on Twitter @TheRealTAL.


His K and BB rates aint getting any better unfortunately. Small increments but, as an owner this year it felt like he struck out soooo many times.