Pitcher Playing Time Changes: August 8, 2025
In our first Pitcher Playing Time Changes roundup since the Trade Deadline, let’s take a look at how the moves made changed how many starts and relief innings we can expect for pitchers down the stretch:
| Name | Team | Old % | New % | PT Chg | Reason |
|---|---|---|---|---|---|
| Anthony DeSclafani | ARI | 3% | 16% | 13% | Took Kelly’s rotation spot |
| Jack Perkins | ATH | 1% | 12% | 11% | Took Sears’ rotation spot |
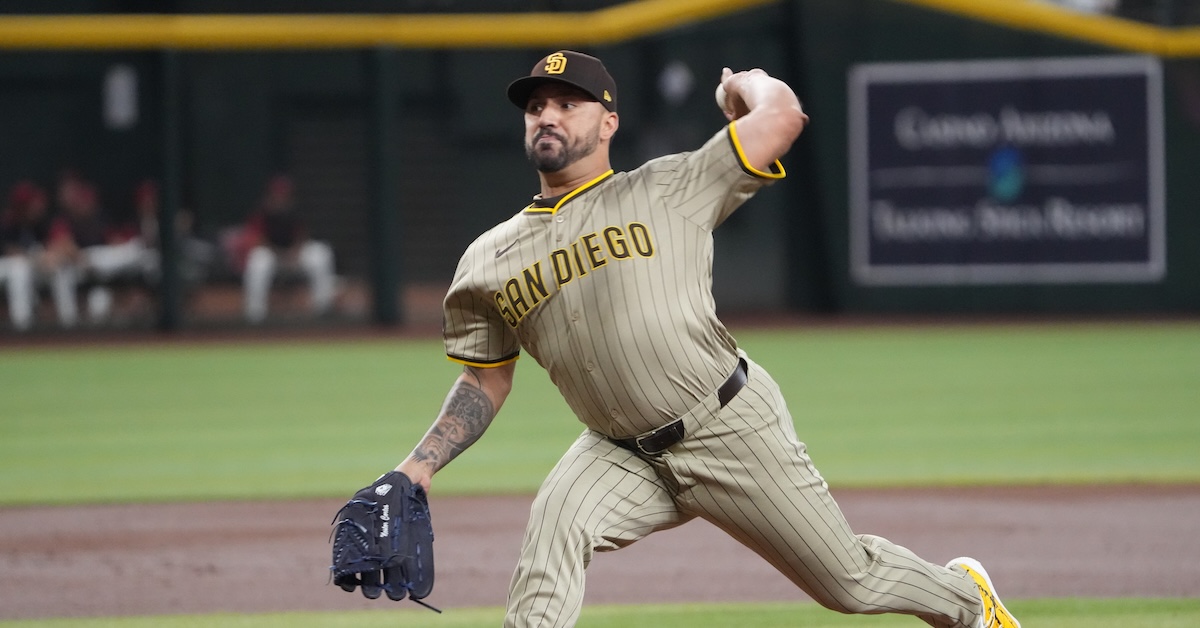
| Nestor Cortes Jr. | SDP | 4% | 14% | 10% | Healthy and in rotation |
| Cade Povich | BAL | 6% | 15% | 9% | Back from IL, took Morton’s spot |
| Dustin May | BOS | 4% | 13% | 9% | From LAD bullpen to BOS rotation |
| Mike Burrows | PIT | 7% | 16% | 9% | Pitching well enough to hold onto rotation spot |
| Hurston Waldrep | ATL | 3% | 10% | 7% | Pitched well in Bristol, taking rotation spot |
| Cristian Javier | HOU | 6% | 12% | 6% | Nearing IL return, though rehab assignment isn’t going great |
| Cam Schlittler | NYY | 10% | 16% | 6% | Stroman release allows him to keep rotation spot |
| Richard Fitts | BOS | 12% | 7% | -5% | May took his rotation spot |
| Tanner Houck | BOS | 5% | 0% | -5% | Tommy John surgery |
| Troy Melton | DET | 6% | 1% | -5% | Moved to bullpen |
| Sawyer Gipson-Long | DET | 10% | 5% | -5% | Rotation spot might not exist when he’s healthy |
| Michael Soroka | CHC | 11% | 6% | -5% | Shoulder strain |
| Antonio Senzatela | COL | 18% | 13% | -5% | Blister |
| Zach Eflin | BAL | 16% | 11% | -5% | Yet another back injury |
| JP Sears | SDP | 13% | 8% | -5% | Sent to AAA |
| Jon Gray | TEX | 9% | 3% | -6% | Should stick in bullpen with Kelly addition |
| Brandon Walter | HOU | 8% | 2% | -6% | Elbow inflammation |
| Tyler Mahle | TEX | 7% | 1% | -6% | Won’t throw off mound for a couple more weeks |
| Simeon Woods Richardson | MIN | 17% | 10% | -7% | IL’d with illness |
| Kumar Rocker | TEX | 14% | 6% | -8% | Kelly took his rotation spot |
| Joey Estes | ATH | 11% | 3% | -8% | Not pitching well at all in AAA |
| Randy Vasquez | SDP | 13% | 3% | -10% | Sent to AAA |
| Marcus Stroman | NYY | 18% | 0% | -18% | Released |
| Name | Team | % Chg in Proj. RP IP | Reason |
|---|---|---|---|
| Bryan Hudson | CHW | 400% | From MIL AAA to CHW MLB |
| Troy Melton | DET | 219% | Moved to bullpen |
| José Ureña | MIN | 167% | Part of rebuilt Twins bullpen |
| PJ Poulin | WSN | 148% | Welcome to MLB! |
| Kumar Rocker | TEX | 138% | Bullpen might be the only place for him to get back to MLB this year |
| Dauri Moreta | PIT | 123% | Back from AAA |
| Joe Ross | PHI | 93% | Back from IL |
| Yosver Zulueta | CIN | 92% | Back from AAA |
| Luis García | HOU | 83% | Bullpen might be the spot for him when healthy |
| Walker Buehler | BOS | 83% | How long will he survive in rotation? |
| Isaiah Campbell | BOS | 73% | Brought back up from AAA |
| Shinnosuke Ogasawara | WSN | 71% | Brought back up from AAA |
| Orlando Ribalta | WSN | 48% | Brought back up from AAA |
| Andrew Hoffmann | ARI | 43% | Should get long look in ARI bullpen |
| José Alvarado | PHI | 35% | Nearing return from suspension |
| Michael Lorenzen | KCR | 33% | Bullpen might be the spot for him when healthy |
| Thomas Hatch | MIN | 30% | Part of rebuilt Twins bullpen |
| Nick Sandlin | TOR | -31% | Return from elbow inflammation unclear |
| Tim Herrin | CLE | -32% | Sent to AAA |
| Bowden Francis | TOR | -33% | Roster fit unclear when healthy |
| Jacob Webb | TEX | -33% | Return from back spasms unclear |
| Jonathan Loáisiga | NYY | -34% | Back tightness |
| Ian Hamilton | NYY | -35% | Sent to AAA |
| Jake Bird | NYY | -35% | Sent to AAA |
| Lyon Richardson | CIN | -36% | Sent to AAA |
| Colton Gordon | HOU | -36% | Pitching well in rotation |
| Chris Devenski | NYM | -42% | Outrighted |
| Kirby Yates | LAD | -43% | Back discomfort |
| Nestor Cortes Jr. | SDP | -46% | Should stick in rotation |
| Dustin May | BOS | -48% | Should stick in rotation |
| Daniel Robert | PHI | -48% | Sent to AAA |
| Seth Halvorsen | COL | -49% | Elbow strain |
| Brad Lord | WSN | -56% | Pitching well since move to rotation |
| Joe Jiménez | ATL | -58% | Injury setback |
| JT Brubaker | NYY | -71% | Released |
| Anthony DeSclafani | ARI | -77% | Moved to rotation |
| Tanner Houck | BOS | -100% | Tommy John surgery |
| Adrian Houser | TBR | -100% | Big acquisition cost, should stay starting |
| Shane Baz | TBR | -100% | Should stick in rotation |
| Trevor Rogers | BAL | -100% | Pitching excellently in rotation |
| Lance McCullers Jr. | HOU | -100% | Will have rotation spot waiting when healthy |
| Kevin Ginkel | ARI | -100% | 60-day IL (shoulder) |
| Trent Thornton | SEA | -100% | Torn Achilles |
| Jacob Lopez | ATH | -100% | Pitching excellently in rotation |
| Justin Lawrence | PIT | -100% | Has been throwing side sessions but might not be enough time to get back |
