Yesterday, I discussed 10 hitters that have recently joined starting lineups as every day or near every day hitters. However, there were so many of them that I only got through half the teams. So let’s get through the rest to see if we can uncover some potential gems over the final two months of the season.
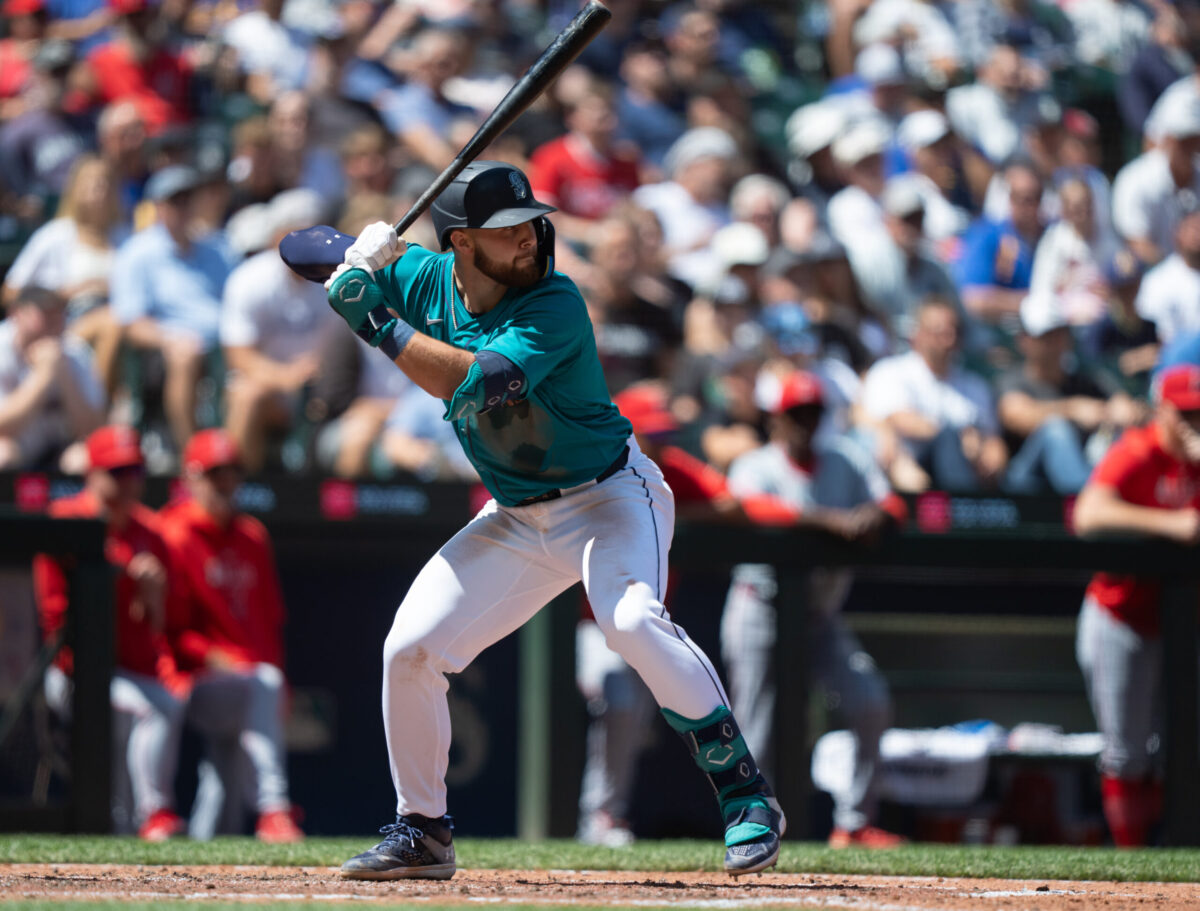
Mandatory Credit: Stephen Brashear-USA TODAY Sports
The trade deadline is now officially in the rearview mirror, which means we’re now seeing lots of new faces in starting lineups. It could be very difficult to keep up with all the playing time changes. So let’s once again dive into 10 names who are now starting regularly, whether due to trading of the incumbent opening up a spot, injury atop the depth chart, or hot hitting.
Yesterday, I dove into the park factors to help speculate how Josh Naylor and Ryan McMahon’s new homes might impact their results. Of course, the trades have a domino effect, both on the players whose positions they are filling on their new teams, and the players who will now replace them in their former lineups. Let’s now review the fallout on the teams they were traded from.
We finally got some trade deadline action! Last Thursday, the Mariners acquired Josh Naylor from the Diamondback and then on Friday, the Yankees acquired Ryan McMahon from the Rockies. Let’s dive into the park factors to find out how the trades might affect their offensive results.
It could be difficult to keep up with the constant changes within starting lineups and easy to miss that a hitter was recently recalled from the minors and is now starting regularly or suddenly enjoying more playing time than he had been. This is especially true now as teams have been calling up their prospects and we’ll see a lot more of it as we approach the trade deadline. So let’s discuss 10 names that are seeing regular playing time now, or close to it, that you may not have even realized.
With nearly two and a half months left in the season, it’s time to either protect your pitching ratios if you’re at or near the top of the categories, or aggressively speculate on arms to hopefully gain additional points by the end of the season. One way to identify names to speculate on is by reducing the innings pitched minimum and checking out the SIERA leaderboard. That way you’ll get more recently recalled names in there too and although the sample size may be smaller, the wider search at least surfaces such names to further evaluate.
Yesterday, I asked you to vote on which group of starting pitchers you expect to post a better ERA over the rest of the season. One group was composed of the 10 largest SIERA overperformers, while the other comprised the underperformers. Let’s now shift over to hitters by comparing wOBA to xwOBA and pitting the xwOBA overperformers against the underperformers during the pre-all-star break period.
The All-Star break is here! That means it’s time to get polling. As has become an annual tradition, I’m going to start by comparing starting pitchers’ ERA to SIERA, pitting the SIERA overperformers against the underperformers during the pre-all-star break period. This is the poll I began with back in 2013.
On Sunday, I read the following comment on Rotoworld about Chase Burns‘ start:
His fastball was located well, but, as has been true in his first two starts, he doesn’t get tons of whiffs on the pitch. He had eight whiffs on 55 total fastballs in this one, with a whopping 16 foul balls. His fastball has below average extension and simply isn’t as elite of a pitch against big league hitters who can handle high velocity.
Sure enough, his four-seamer has generated just a 7.6% SwStk% despite the pitch averaging a scintillating 98.2 MPH. So it got me thinking about perceived velocity, which extension affects. If a pitcher is throwing 95 MPH, but the batter perceives the pitch’s velocity to actually be 97 MPH, or perhaps 93 MPH, that should matter, right? I would therefore think the gap between perceived and actual velocity would influence the pitch’s whiff rate and the pitcher’s strikeout rate. So I decided to dive in and find out if that theory is true.
Last week, I reviewed how the top hitting prospect have performed in the Majors this year. Today, let’s flip over to the pitching prospects. This time, I’ll be using the Post-Spring Training Top 100 Prospects Update, instead of the preseason list.