Ideal Home Run Angles And the Players Who Hit Them
Statcast has afforded us many new ways of examining well struck batted balls. We’ve been given quantifiable evidence that Giancarlo Stanton hits the ball harder than anyone else in the game, for instance. That is a neat trivium to exhale after witnessing one of his line drives, but it isn’t particularly helpful for analysis. Factoring in the vertical launch angle certainly gets us much closer to valuable information. We have statistics such as ‘Barrels’, which display the league average values for batted balls based upon those with similar exit velocity and vertical launch angle. However, this two dimensional approach fails to fully explain the three dimensionality of the game we love.
Balls hit to center field are significantly different, on a qualitative level, than those hit down the line. For starters, the fences are deeper in center field and more shallow down the lines. Additionally, balls hit down the line will have a different spin profile than those hit to center field. They may spin at a different rate, and in a different direction, causing the ball to slice or hook, or draw or fade if the effect isn’t as severe. Furthermore, once a ball has sufficiently sliced or hooked, it will begin to lose the benefit of the lift bestowed by its backspin, and as a result it will fall ever more quickly out of the air as it travels, limiting the maximum attainable distance.
I’ve sought to find exactly how much home run rates change with horizontal angle when assuming ideal exit velocities and vertical launch angles, which players hit the most balls on these ideal angles, and what their individual success rates look like when compared to league averages.
First I’ll begin by finding the ideal vertical launch angles for home runs. We already know the ideal launch angle should be right around 27 degrees, but I’m not sure how well publicized the range is on either side. I sifted through the Statcast data from Baseball Savant and created a chart which you can see below.
| Angle | Number | HR | Percent |
|---|---|---|---|
| 15 | 3654 | 8 | .002 |
| 16 | 3641 | 22 | .006 |
| 17 | 3677 | 37 | .010 |
| 18 | 3711 | 99 | .027 |
| 19 | 3542 | 173 | .049 |
| 20 | 3598 | 276 | .077 |
| 21 | 3523 | 430 | .122 |
| 22 | 3446 | 501 | .145 |
| 23 | 3343 | 592 | .177 |
| 24 | 3225 | 657 | .204 |
| 25 | 3189 | 762 | .239 |
| 26 | 3123 | 719 | .230 |
| 27 | 3157 | 805 | .255 |
| 28 | 2984 | 721 | .242 |
| 29 | 2983 | 700 | .235 |
| 30 | 2845 | 654 | .230 |
| 31 | 2820 | 557 | .198 |
| 32 | 2569 | 515 | .201 |
| 33 | 2431 | 445 | .183 |
| 34 | 2417 | 334 | .138 |
| 35 | 2388 | 334 | .140 |
| 36 | 2184 | 277 | .127 |
| 37 | 1996 | 177 | .089 |
| 38 | 1962 | 117 | .060 |
| 39 | 1835 | 102 | .056 |
| 40 | 1731 | 84 | .049 |
| 41 | 1618 | 54 | .033 |
| 42 | 1519 | 36 | .024 |
| 43 | 1409 | 27 | .019 |
| 44 | 1436 | 18 | .013 |
| 45 | 1350 | 8 | .006 |
| 46 | 1238 | 5 | .004 |
| 47 | 1123 | 0 | .000 |
| 48 | 1151 | 2 | .002 |
| 49 | 1078 | 3 | .003 |
| 50 | 1102 | 1 | .001 |
You can see that the home run rates take a pretty significant bump around 25 degrees, steadily rise until 27-28 degrees, then slowly fade until 30 degrees where the rates take another sudden drop downwards and trail off towards zero. For the purposes of finding the ideal launch window, I’ve decided to draw an arbitrary cut-off point of a 10% home run rate, so I’m going to call any ball hit between 21 and 36 degrees an ideal hit. Balls hit between these angles account for 9003 of the 10519 home runs hit in the past two seasons, which is about 86% of the total. About 19.3% of the balls hit on these angles, regardless of other factors, became home runs, which is pretty impressive in its own right.
Next I factored in exit velocity to batted balls hit between 21 and 36 degrees of vertical angle.
| Speed | Number | HR | Percent |
|---|---|---|---|
| 80 | 692 | 0 | .000 |
| 81 | 738 | 1 | .001 |
| 82 | 768 | 0 | .000 |
| 83 | 840 | 0 | .000 |
| 84 | 885 | 0 | .000 |
| 85 | 977 | 0 | .000 |
| 86 | 1027 | 0 | .000 |
| 87 | 1056 | 2 | .002 |
| 88 | 1205 | 3 | .003 |
| 89 | 1272 | 9 | .007 |
| 90 | 1350 | 9 | .007 |
| 91 | 1396 | 23 | .017 |
| 92 | 1518 | 45 | .030 |
| 93 | 1607 | 59 | .037 |
| 94 | 1592 | 91 | .057 |
| 95 | 1671 | 137 | .082 |
| 96 | 1712 | 207 | .121 |
| 97 | 1639 | 246 | .150 |
| 98 | 1742 | 379 | .218 |
| 99 | 1716 | 473 | .276 |
| 100 | 1615 | 579 | .359 |
| 101 | 1546 | 684 | .442 |
| 102 | 1438 | 776 | .540 |
| 103 | 1358 | 878 | .647 |
| 104 | 1115 | 798 | .716 |
| 105 | 983 | 755 | .768 |
| 106 | 805 | 690 | .857 |
| 107 | 649 | 573 | .883 |
| 108 | 499 | 453 | .908 |
| 109 | 355 | 330 | .930 |
| 110 | 201 | 189 | .940 |
| 111 | 140 | 135 | .964 |
| 112 | 81 | 79 | .975 |
| 113 | 37 | 37 | 1.000 |
| 114 | 14 | 14 | 1.000 |
| 115 | 10 | 10 | 1.000 |
| 116 | 4 | 4 | 1.000 |
| 117 | 2 | 1 | .500 |
| 119 | 1 | 1 | 1.000 |
With velocity, you’ll see the batted balls steadily rise in value with velocity. I have decided to use the same arbitrary 10% HR% cut off, so I’ll just be looking at batted balls hit over 96 mph. This will limit us to the top 8291 HR of that 10519 sample (79%). About 47% of the batted balls hit over 96 mph on a 21 to 36 degree launch angle are home runs. Pretty impressive.
Finally, factoring in the horizontal launch angle. I am forced to find the horizontal launch angle using the gameday x and y coordinates, which are an estimate of the location on the field in which the defender made a play on the ball. This is far from perfect, it would be much better to use a more sophisticated measurement tool, but unfortunately these coordinates are the best we have publicly available. I’ve mapped these coordinates such that zero degrees indicates dead center field, -45 degrees is left field, and 45 degrees is right field. More importantly, I am taking the absolute value of these angles, so bear in mind that the larger the number, the further from center field. The gameday coordinates I am using range to about 50 degrees, 5 degrees past the foul pole, which allows for balls which may hook or slice around the foul pole.
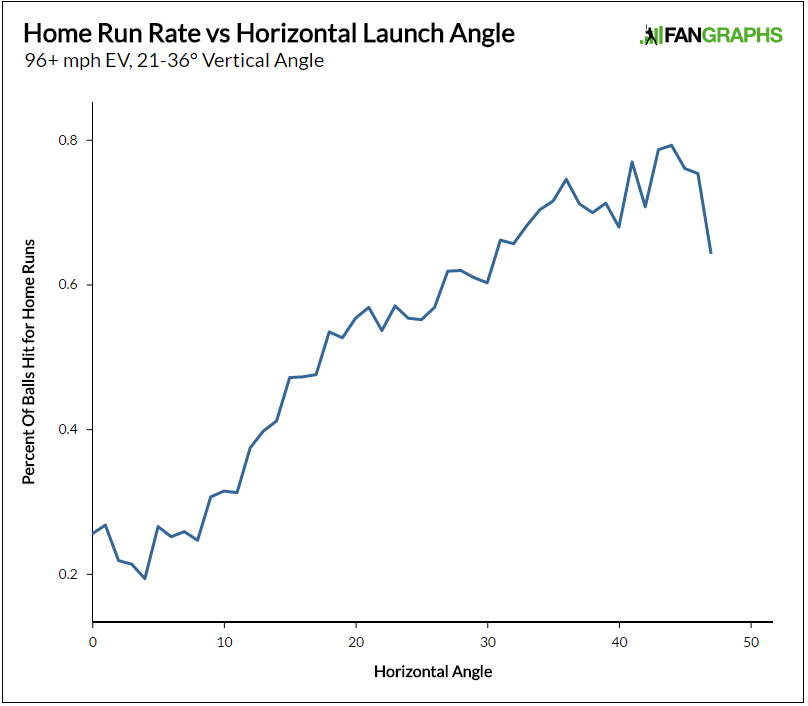
As expected, the home run rates go up with angle as you get closer to the foul poles. It may be surprising to you that home run rates more than triple between zero degrees, ie center field, and 44 degrees, near the foul pole. Yes, the fence is shorter, but going from 25% to 79% is a pretty steep climb in value for what amount to similarly well hit balls. To see the full table, look here.
On to the players. I’ve created a table of players who have had 300+ PA using this data. First, it is important to note that the column called “HH” represents these well struck balls: those hit between 21 and 36 degree vertical launch angle, 9 and 47 degrees horizontal angle, and 96+ mph. The Home Run, Horizontal Angle and EV columns count only those batted balls which are also a “HH.”
| name | PA | H angle | EV | AVG | SLG | HH | HR | HR/HH | HH/PA | HR/PA |
|---|---|---|---|---|---|---|---|---|---|---|
| Evan Longoria | 684 | 22.8 | 102.1 | .796 | 2.722 | 56 | 31 | .554 | .082 | .045 |
| Miguel Cabrera | 678 | 25.5 | 103.9 | .620 | 2.200 | 50 | 25 | .500 | .074 | .037 |
| Brian Dozier | 692 | 24.9 | 101.4 | .878 | 3.204 | 49 | 34 | .694 | .071 | .049 |
| Victor Martinez | 608 | 23.4 | 100.5 | .581 | 2.000 | 43 | 19 | .442 | .071 | .031 |
| Nick Castellanos | 445 | 22 | 102 | .581 | 1.903 | 31 | 11 | .355 | .070 | .025 |
| Matt Kemp | 671 | 23 | 102.4 | .761 | 2.739 | 46 | 28 | .609 | .069 | .042 |
| Khris Davis | 608 | 24.8 | 105 | .857 | 3.119 | 42 | 29 | .690 | .069 | .048 |
| Kyle Seager | 671 | 24.6 | 100.3 | .727 | 2.409 | 44 | 21 | .477 | .066 | .031 |
| Matt Carpenter | 564 | 24.4 | 101.2 | .703 | 2.378 | 37 | 17 | .459 | .066 | .030 |
| Yasmany Tomas | 563 | 27.2 | 101.9 | .838 | 2.973 | 37 | 25 | .676 | .066 | .044 |
I am personally fascinated that Evan Longoria tops this list, and I am equally surprised that Trout failed to make the cut. Trout’s HH/PA is .48, so he missed the top ten by quite a margin. However, these ten guys have hit the most balls per plate appearance on these ideal angles and exit velocities, and as a result, you’d expect them to hit quite a number of home runs per plate appearance. With the exception of Nick Castellanos, each of these guys hit quite a number of home runs. If you extend their seasons out to 700PA each, all but Castellanos would have hit at least 21 home runs, with Longoria leading the way with 37. And note, these are only the home runs hit on these ideal angles (which account for 7233 of the 10519 home runs hit, 69%). These batters would have hit more home runs on other, slightly weaker launch angles as well.
| name | PA | H angle | EV | AVG | SLG | HH | HR | HR/HH | HH/PA | HR/PA |
|---|---|---|---|---|---|---|---|---|---|---|
| Didi Gregorius | 593 | 34.2 | 99.4 | 1.000 | 3.714 | 14 | 12 | .857 | .024 | .020 |
| Joc Pederson | 473 | 29 | 104.3 | .950 | 3.600 | 20 | 17 | .850 | .042 | .036 |
| Yoenis Cespedes | 538 | 23.2 | 104 | .880 | 3.520 | 26 | 22 | .846 | .048 | .041 |
| Yasmani Grandal | 455 | 26.2 | 103.8 | .857 | 3.333 | 21 | 17 | .810 | .046 | .037 |
| Jake Lamb | 595 | 23 | 103.2 | 1.000 | 3.615 | 26 | 21 | .808 | .044 | .035 |
| Wilmer Flores | 334 | 27.9 | 101.5 | .867 | 3.333 | 15 | 12 | .800 | .045 | .036 |
| Chris Davis | 662 | 24.7 | 104.7 | .857 | 3.238 | 42 | 33 | .786 | .063 | .050 |
| Giancarlo Stanton | 468 | 24.8 | 106.4 | .889 | 3.333 | 18 | 14 | .778 | .038 | .030 |
| Curtis Granderson | 631 | 30 | 101.9 | .923 | 3.462 | 26 | 20 | .769 | .041 | .032 |
| Jonathan Schoop | 641 | 28.6 | 103.9 | .905 | 3.333 | 21 | 16 | .762 | .033 | .025 |
These are the top ten batters by HR/HH. I believe, although I don’t have much evidence to back it up, these batters are candidates to have their home run rates regress the most. These guys each have HR/HH that are between 32 and 50% higher than league average, and I think we can all agree a guy like Didi Gregorius is unlikely to maintain a home run rate that tops the majors in this category, or any category for that matter. Guys like Stanton and Cespedes and will likely remain perennial members of this list (they both made it in 2015 as well). Oddly enough, Wilmer Flores has list in both 2015 and 2016, and with the exact same .800 in both seasons at that. Grandal had no change in HH/PA between 2015 and 2016, but a large increase in HR/HH (+.190) and HR (+6). It seems unlikely he will be able to maintain this type of production.
| name | HR/HHΔ | HH/PAΔ | HR/PAΔ | HRΔ |
|---|---|---|---|---|
| Jake Marisnick | .000 | -.029 | -.015 | -6 |
| Giancarlo Stanton | -.079 | -.028 | -.027 | -4 |
| Jose Bautista | -.172 | -.026 | -.022 | -19 |
| Brandon Crawford | .014 | -.025 | -.011 | -5 |
| Danny Valencia | .100 | -.022 | -.011 | -1 |
| Paul Goldschmidt | .054 | -.021 | -.011 | -7 |
| Adrian Gonzalez | -.012 | -.020 | -.011 | -8 |
| Jonathan Schoop | .056 | -.020 | -.012 | 4 |
| Josh Donaldson | .003 | -.019 | -.013 | -11 |
| Kelly Johnson | -.031 | -.019 | -.014 | -5 |
Finally, ten players who had the largest drops in HH/PA between 2015 and 2016. These players fall into a weird limbo type area, as each of them remain somewhat above average, while also being significantly below the tally they put up in 2015. It would be nice to have a third year of data to look at here, but unfortunately that isn’t available.
Jose Bautista is an aging player, so seeing this sort of decline in him is both somewhat expected and also a bit alarming, judging by his free agent status at the moment. He has lost more than 1 mph off these ideally hit balls, and his average vertical angle has dropped from about 25 degrees, primed for home runs, down to about 24 degrees, which is less than ideal. By the chart up above, balls 24 degrees are about 14% less likely to be a home run than balls hit on 25 degrees. Could this be a blip, some statistical noise? Perhaps. But it could also be a sign of things to come.
If you would like to play around with this data and see where your favorite players fall into place, feel free to look at the full spreadsheet.
Andrew Perpetua is the creator of CitiFieldHR.com and xStats.org, and plays around with Statcast data for fun. Follow him on Twitter @AndrewPerpetua.
What was the 117mph, ideal angle hit that didn’t become a HR?
It was a double by Chris Davis on 2015-10-03.
116.6 mph
25.2 v angle
13.9 h angle
2 outs, bottom of the 1st inning, nobody on against the Yankees. Ivan Nova on the mound, 93mph fastball.