Hitter/Pitcher Budget Split in Ottoneu
When I wrote about relief pitcher spend last week, I kept looking at the data I was using – Opening Day rosters and end of season results for all OPL-eligible FanGraphs Points leagues – and thinking about all the other questions I could explore. It took a lot to stay focused on bullpens. But with that behind me, I can now turn my attention to a topic I have wrestled with for years: how to split budget between hitters and pitchers.
Over the years, I have gone a number of different routes for splitting budget when setting my values. My preference has always been to not set a budget split, at all. A point is a point, after all, and if there are X points available across all eligible players, getting 500 points over replacement level from a SP is the same as getting 500 points over replacement from a SS. If the goal is to get to 18K points (the average league champ in my data scored 18,332.9), it doesn’t really matter if you get 9K from your bats and 9K from your arms or if the split is 12K/6K or anything else.
But now we have the data to look back at 2024 and see, in practice, what was the most effective way to split dollars last year.
A couple of important reminders:
- This data is from Opening Day, so it will include changes people made via trade or free agency after auctions. I did remove leagues that did not appear to have drafted yet, so we don’t have to worry about that skewing the data, but these rosters are not excatly post-auction. There were 47 teams (out of 1,596 total) that were over $400 in salary as of Opening Day.
- This is showing us what was true in 2024, not what is always true or what will be true in 2025. I think this data is pretty representative but there are things that could make a single season an outlier in hitter/pitcher split. If a surprising number of major injuries hit high-priced bats or arms, that could skew things. 2024 did see a lot of pitcher injuries, but so does every season, these days. If the ball is surprisingly lively or dead, that could shift value towards hitters or pitchers. But I don’t think that happened in 2024.
Before sharing the data, I did ask some Ottoneu managers what they thought the ideal budget split was. What I got was a combination of managers saying there was no ideal split and a answers ranging from 55-45 to 65-35, always with the idea that you spend more on bats. This isn’t surprising – fantasy baseball players have long preferred to spend on offense, plus Ottoneu gives you 12 offensive slots and 1,944 offensive games to be played vs. 10 pitcher slots and 1,500 innings to pitch. There is just more need for offense. I would be very surprised to learn that teams that spent more than 50% of their budget on pitching outperformed those that spent more on bats; the real question is: how much more should you spend on bats.
To do this, I added up all spend on bats and arms for each team, and then found each team’s “hitter %” or H% – the percent of money they spent on hitters as calculated by [money spent on bats]/[money spent on bats + money spent on arms]. I did not exclude prospects, so if teams spend more on offensive prospects, which is likely, that may skew this a bit, but I doubt it would skew it enough to change the results meaningfully. I also took H% as a share of the total spent not of the $400 budget. So $250 on bats and $130 on arms, is 64% (250/380) and not 62.5% (250/400).
With that, here is a first look at what I found:
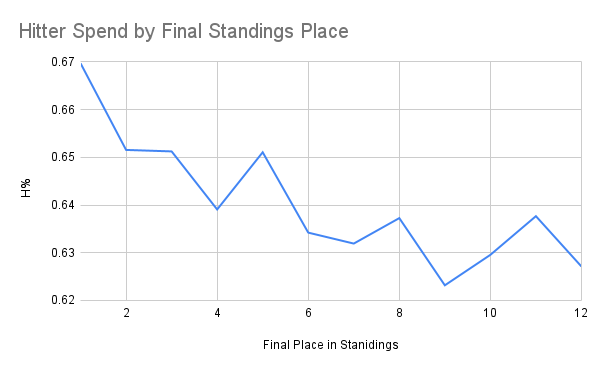
Pretty clear relationship here, as league champs neared 67% H% and no one else was much over 65%. The lower the spot in the standings, the less a team spent on hitting, in general. This graph, though, begs the question – how high is too high? It is possible that spending 65-70% of your spend on hitters is ideal, and that going much over that hurts, but is drowned out in this graph by low H% in the worse finishing spots.
As with the RP spend, I created deciles of teams based on H% and looked at how those teams faired in terms of points scored over the season and their average finish.
| H% Decile | H% Range | Number of Teams | Avg H% | Avg Ponts Scored | Average Finish |
|---|---|---|---|---|---|
| 1 | 73.51% – 85.71% | 159 | 76.8% | 16246.9 | 5.75 |
| 2 | 70.38% – 73.50% | 160 | 72.5% | 16228.6 | 5.79 |
| 3 | 67.82% – 70.37% | 159 | 69.1% | 15654.3 | 6.46 |
| 4 | 65.91% – 67.81% | 160 | 66.9% | 15944.5 | 6.13 |
| 5 | 62.26% – 65.90% | 160 | 65.0% | 15728.6 | 6.57 |
| 6 | 62.47% – 62.25% | 159 | 63.4% | 15783.6 | 6.66 |
| 7 | 60.37% – 62.24% | 160 | 61.4% | 15717.2 | 6.26 |
| 8 | 57.97% – 60.37% | 160 | 59.2% | 15655.5 | 6.70 |
| 9 | 54.30% – 57.96% | 159 | 56.3% | 15282.4 | 7.13 |
| 10 | 39.06% – 54.29% | 160 | 50.6% | 15149.4 | 7.56 |
These results back up what we saw on the graph above and go even further. The teams that put more than 73% of their budget towards hitters outscored all other deciles and finished higher in the standings than any others. The top quintile – spending 70.38% on hitters or more – are quite clearly stronger than the other 80% of teams.
And, at the other end, teams that were under 58% spent on hitters were a few hundred points below everyone else and the only deciles to finish worse than 7th on average.
What if we look at winning your league or at least finishing top three?
| H% Decile | H% Range | Number of Teams | Avg H% | # of Champs | Champ Rate | # of Top 3 | Top 3 Rate |
|---|---|---|---|---|---|---|---|
| 1 | 73.51% – 85.71% | 159 | 76.8% | 19 | 11.9% | 53 | 33.3% |
| 2 | 70.38% – 73.50% | 160 | 72.5% | 20 | 12.5% | 51 | 31.9% |
| 3 | 67.82% – 70.37% | 159 | 69.1% | 17 | 10.7% | 45 | 28.3% |
| 4 | 65.91% – 67.81% | 160 | 66.9% | 16 | 10.0% | 47 | 29.4% |
| 5 | 62.26% – 65.90% | 160 | 65.0% | 14 | 8.8% | 39 | 24.4% |
| 6 | 62.47% – 62.25% | 159 | 63.4% | 13 | 8.2% | 36 | 22.6% |
| 7 | 60.37% – 62.24% | 160 | 61.4% | 17 | 10.6% | 47 | 29.4% |
| 8 | 57.97% – 60.37% | 160 | 59.2% | 7 | 4.4% | 30 | 18.8% |
| 9 | 54.30% – 57.96% | 159 | 56.3% | 7 | 4.4% | 30 | 18.9% |
| 10 | 39.06% – 54.29% | 160 | 50.6% | 3 | 1.9% | 21 | 13.1% |
This doesn’t exactly contradict what we saw above – the top two deciles are still the most likely to win their leagues and to finish top-three. But it does make things look a bit more balanced. Three other deciles, including the 7th decile, had championship rates over 10%. Remember one champ per 12 teams means you expect a championship rate of 8.33%, so six of the top seven deciles were more likely than random chance to win a title, and the other was very close to that line.
The message from the first table might have been “spend more on hitting to score more points and finish higher in the standings” but the message from the second is “you can win your league with a variety of different approaches.”
Unless, that is, your approach is below 60% H%. Once you drop down to 60% or lower, you are half as likely to win your league. Around some of the mock drafts going on right now (check out my Bluesky thread on results from those), there was some chatter about a 225-175 split. That would be a 56.3% H%, which is exactly the average of the 9th decile and those teams did not do particularly well. Actually, they did really poorly.
Now, if you are looking at the first table and thinking, “Oh wow the more you spend on hitters the better, there is no ceiling!” then you are basically where I was after I looked at that table. And, to be honest, the second table didn’t stop me from thinking that. But I was curious if there really were no ceiling.
And the answer is – the ceiling is hard to find.
| H% Range | Number of Teams | Avg H% | Avg Ponts Scored | Average Finish | # of Champs | Champ Rate | # of Top 3 | Top 3 Rate |
|---|---|---|---|---|---|---|---|---|
| 82%+ | 13 | 83.6% | 15818.8 | 6.15 | 2 | 15.4% | 5 | 38.5% |
| 80%+ | 25 | 82.4% | 15933.3 | 6.76 | 3 | 12.0% | 6 | 24.0% |
| 78%+ | 43 | 80.9% | 16205.1 | 6.14 | 10 | 23.3% | 15 | 34.9% |
| 75%+ | 99 | 78.4% | 16263.0 | 5.72 | 15 | 15.2% | 35 | 35.4% |
| 73.51% – 85.71% | 159 | 76.8% | 16246.9 | 5.75 | 19 | 11.9% | 53 | 33.3% |
That table compares the top decile from above (the last row) to progressively higher H% thresholds. As we push up towards and past 80% H%, average finish gets worse, points scored gets worse, but there are still plenty of champs in that group.
There is another caveat to this though. Because this is Opening Day, there are some teams that had made trades to go over $400 in cap by this time. If a team traded for a $70 Juan Soto or Aaron Judge by this date, that would both skew their chances of winning the league and drive up their H%. So let’s remove all teams that are over $400 salary.
| H% Decile | H% Range | Number of Teams | Avg H% | Avg Ponts Scored | Average Finish | # of Champs | Champ Rate | # of Top 3 | Top 3 Rate |
|---|---|---|---|---|---|---|---|---|---|
| Top 0.8% | 82%+ | 12 | 83.7% | 15649.3 | 6.42 | 2 | 16.7% | 4 | 33.3% |
| Top 1.5% | 80%+ | 24 | 82.4% | 15853.3 | 6.92 | 3 | 12.5% | 5 | 20.8% |
| Top 2.6% | 78%+ | 40 | 81.0% | 16036.0 | 6.48 | 8 | 20.0% | 12 | 30.0% |
| Top 5.9% | 75%+ | 92 | 78.4% | 16143.2 | 5.93 | 12 | 13.0% | 29 | 31.5% |
| 1 | 73.51% – 85.71% | 151 | 76.7% | 16160.9 | 5.92 | 15 | 9.9% | 46 | 30.5% |
| 2 | 70.38% – 73.50% | 154 | 72.5% | 16193.9 | 5.85 | 19 | 12.3% | 48 | 31.2% |
| 3 | 67.82% – 70.37% | 150 | 69.1% | 15647.7 | 6.47 | 17 | 11.3% | 43 | 28.7% |
| 4 | 65.91% – 67.81% | 151 | 66.9% | 15833.1 | 6.31 | 11 | 7.3% | 41 | 27.2% |
| 5 | 62.26% – 65.90% | 157 | 65.0% | 15682.8 | 6.65 | 13 | 8.3% | 36 | 22.9% |
| 6 | 62.47% – 62.25% | 157 | 63.4% | 15806.3 | 6.62 | 13 | 8.3% | 36 | 22.9% |
| 7 | 60.37% – 62.24% | 158 | 61.4% | 15696.2 | 6.28 | 17 | 10.8% | 46 | 29.1% |
| 8 | 57.97% – 60.37% | 159 | 59.2% | 15648.3 | 6.71 | 7 | 4.4% | 30 | 18.9% |
| 9 | 54.30% – 57.96% | 155 | 56.3% | 15285.8 | 7.12 | 7 | 4.5% | 29 | 18.7% |
| 10 | 39.06% – 54.29% | 157 | 50.6% | 15147.0 | 7.58 | 3 | 1.9% | 20 | 12.7% |
That table shows the deciles and the higher threshold top tiers and you get a slightly different story. The second decile is now the “best” decile in terms of total points, average finish, championship rate, and top-three rate. Interestingly, the super-high H% tiers are still most likely to be league-winners, but they are scoring less on average and finishing worse, on average, than that second decile.
Cutting out all teams over $400 spend is a pretty blunt instrument for what I was trying to do. Some teams may be over $400 because they traded for a $40 Zack Wheeler. Some teams might have acquired a $50 Mookie Betts, but only gone up to $399 in total spend because they also cut a $50 Gerrit Cole when he got hurt. But even trying to limit the impact of trades suggests that, once you take those teams out, there is, in fact, an H% ceiling where you get diminishing returns, and it is somewhere in the 70-75% range.
For me, the big takeaway here is that I should probably budget more towards offense and less towards pitching. That likely means spending more time in the off-season trying to trade for inexpensive pitching to put myself in a position to field a strong pitching staff while budgeting something like $280 to hitters and just $120 to pitchers.
Of course, that assumes I plan to budget all $400, which leads me to another question – how much should I plan to spend coming out of the auction? We’ll have to look at that next time.
A long-time fantasy baseball veteran and one of the creators of ottoneu, Chad Young's writes for RotoGraphs, and can be heard on the Keep or Kut Podcast. You can follow him on Bluesky @chadyoung.bsky.social.
Great article. It would be interesting to compare the same data for H2H leagues. The GS caps are an opportunity to maximize SP production. Anecdotally, it seems like the best teams routinely hit their GS caps for most H2H matchups. It would be interesting how this effects the optimal H%.