Fun with Visualizations: Choose Your Shortstop
Let’s play a game. Here are the instructions:
Step 1: Don’t scroll down to the table!
That would be like reading the answers in the back of the textbook before you read the question. You did it in fifth grade, don’t do it now.
Step 2: Imagine drawing a vertical line in the visual below that does a good job of maximizing the four roto counting stats, SB, HR, RBI, and R. Try not to pick rank one, two, or three.
Step 3: Note your player rank. Now you can scroll down to the table to see who you have chosen.
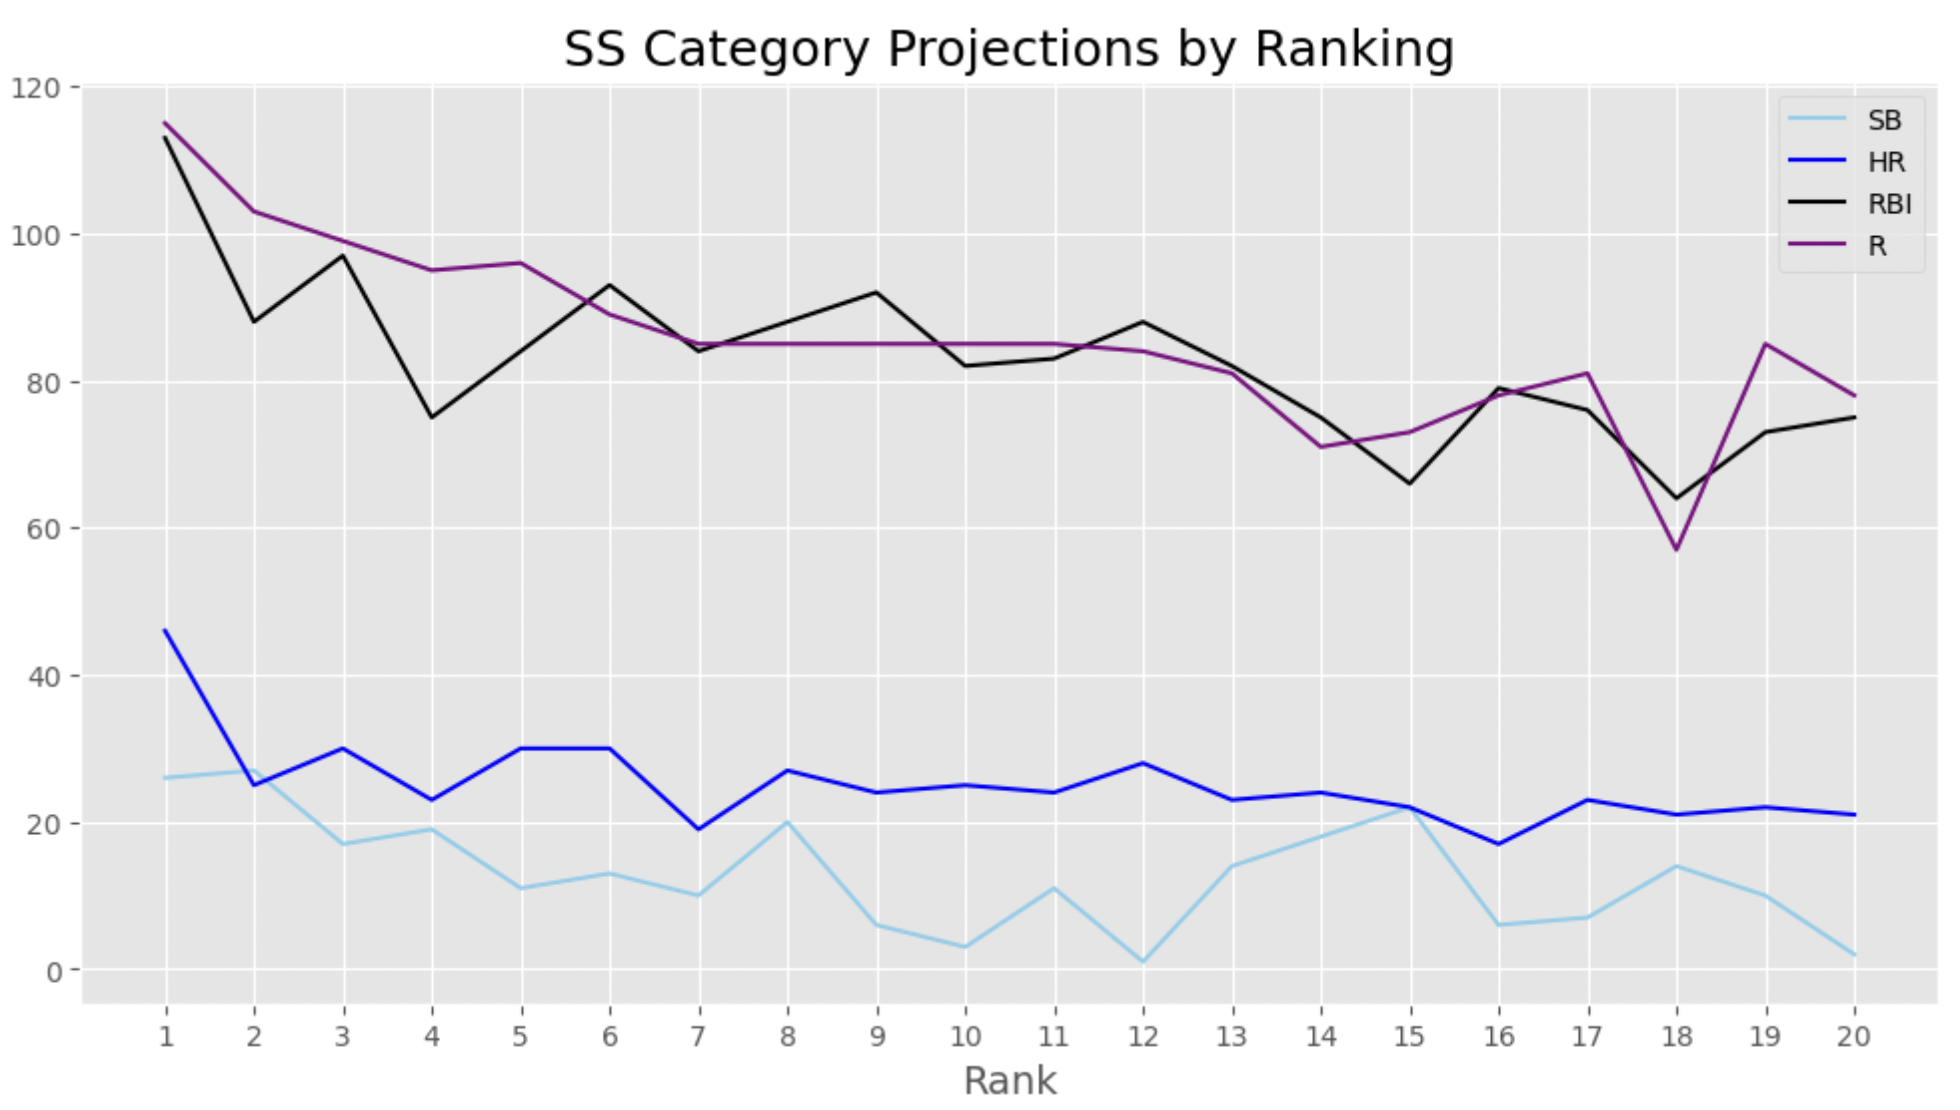
I created these ranks using the default settings of the auction calculator with steamer projections to sort by dollar value. Note that if you wish to do something similar, you should input the parameters of your league accordingly. The point of this exercise is to try to identify players who could be good pickups later in the draft. We so often see tables and spreadsheets and mark single statistics. But, it’s difficult for the human eye to take in all that information and process it. This visual is helpful because it shows us not how single stats like stolen bases decline across the ranks, but how all the counting stats vary across the ranks. For example, if you chose rank 8, you would get a nice little bump in projected (steamer) stolen bases with close to average HR, R, and maybe a little more RBI than some of the lower ranks. Who is this mysterious rank eight? Scroll down to the table to find out.
You, like me, may think, “I can wait for stolen bases. Shortstops seem to have a lot of them.” This visual proves that theory somewhat:
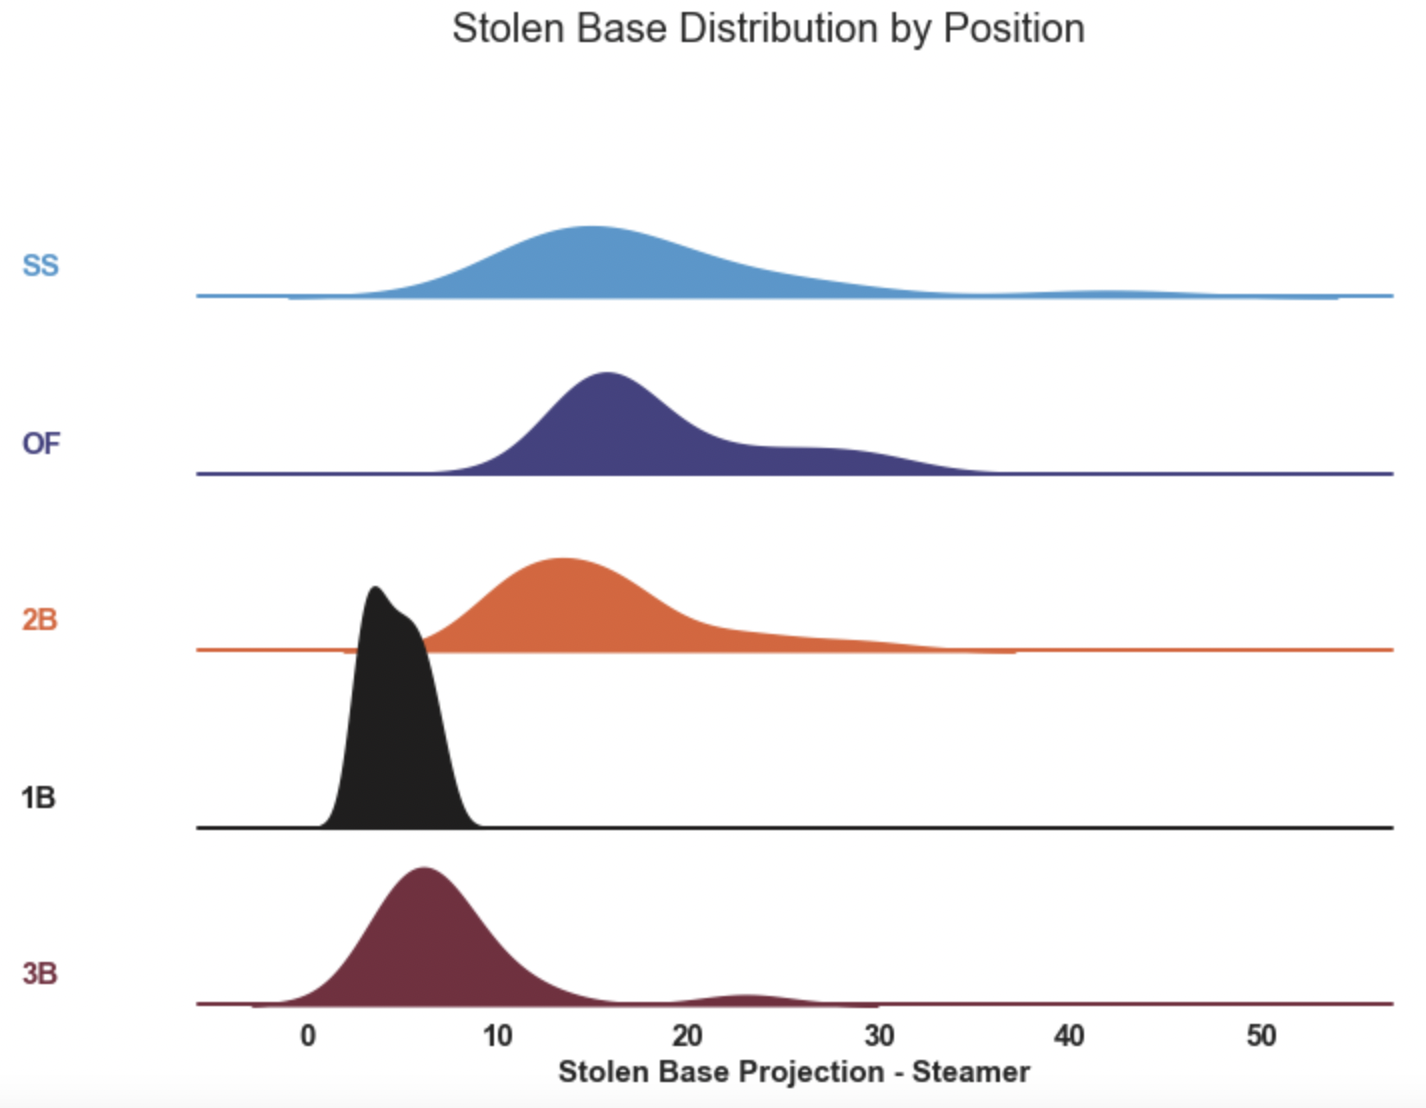
That long tail moving to the right of the shortstop (light blue) distribution shows us that we could potentially pick up a decent amount of steals with a late shortstop pick. However, rank 15 in the first visual shows how much you would sacrifice in projected runs and RBI if you were to employ that strategy. Who is this mysterious rank 15? Scroll down to the table to find out.
I’ve done some mock drafting this offseason using the Fantasy Pros draft simulator and I’ve found that if I don’t get stolen bases early because there are so many good hitters and pitchers that I take instead, I come out very SB-lite. I’ve also noticed that the simulator reaches for base stealers like Tommy Edman, Jazz Chisholm Jr., Akil Baddoo, and Tim Anderson much earlier than I would expect. That’s likely to happen in my actual draft as well. There’s nothing worse than finishing a draft and being really excited about your team and then realizing that you are depleted in a single category, especially if you don’t want to employ a punt strategy. Hopefully, these visuals and a few mock drafts will help you identify optimal draft positions for certain categories. I’m happy to do this same exercise for another position, but only if you’re nice to me in the comments section.
| Rank | PlayerName | POS | ADP | PA | HR | RBI | R | SB | Dollars |
|---|---|---|---|---|---|---|---|---|---|
| 1 | Fernando Tatis Jr. | SS/OF | 1.8 | 677 | 46 | 113 | 115 | 26 | $43.80 |
| 2 | Trea Turner | 2B/SS | 2.0 | 681 | 25 | 88 | 103 | 27 | $31.10 |
| 3 | Bo Bichette | SS | 5.4 | 668 | 30 | 97 | 99 | 17 | $29.70 |
| 4 | Tim Anderson | SS | 34.9 | 692 | 23 | 75 | 95 | 19 | $21.50 |
| 5 | Marcus Semien | 2B/SS | 31.8 | 681 | 30 | 84 | 96 | 11 | $17.10 |
| 6 | Francisco Lindor | SS | 48.7 | 667 | 30 | 93 | 89 | 13 | $16.90 |
| 7 | Wander Franco | SS | 53.5 | 651 | 19 | 84 | 85 | 10 | $16.20 |
| 8 | Trevor Story | SS | 41.0 | 655 | 27 | 88 | 85 | 20 | $16.10 |
| 9 | Xander Bogaerts | SS | 42.8 | 649 | 24 | 92 | 85 | 6 | $15.50 |
| 10 | Corey Seager | SS | 72.1 | 596 | 25 | 82 | 85 | 3 | $14.80 |
| 11 | Jorge Polanco | 2B/SS | 79.3 | 654 | 24 | 83 | 85 | 11 | $14.30 |
| 12 | Carlos Correa | SS | 91.8 | 621 | 28 | 88 | 84 | 1 | $14.20 |
| 13 | Gleyber Torres | SS | 149.6 | 632 | 23 | 82 | 81 | 14 | $14.10 |
| 14 | Robert Witt | SS | 90.9 | 545 | 24 | 75 | 71 | 18 | $12.80 |
| 15 | Jazz Chisholm Jr. | 2B/SS | 79.2 | 568 | 22 | 66 | 73 | 22 | $8.20 |
| 16 | Jake Cronenworth | 1B/2B/SS | 111.9 | 644 | 17 | 79 | 78 | 6 | $7.60 |
| 17 | Willy Adames | SS | 133.8 | 628 | 23 | 76 | 81 | 7 | $7.40 |
| 18 | Oneil Cruz | SS | 224.2 | 457 | 21 | 64 | 57 | 14 | $7.00 |
| 19 | Dansby Swanson | SS | 123.1 | 665 | 22 | 73 | 85 | 10 | $6.60 |
| 20 | Brendan Rodgers | 2B/SS | 152.1 | 586 | 21 | 75 | 78 | 2 | $5.00 |
Cool article concept and visualization with the distribution by position. I vote for more of these!
Agree. I love this!