Estimating Pitch Results from a Small Sample
A few days ago, I wrote an article examining Reid Detmers. For Detmers, I posted the following table on comparable curveballs and the lack of results.
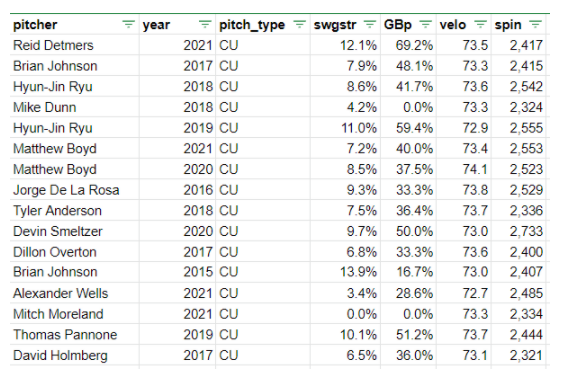
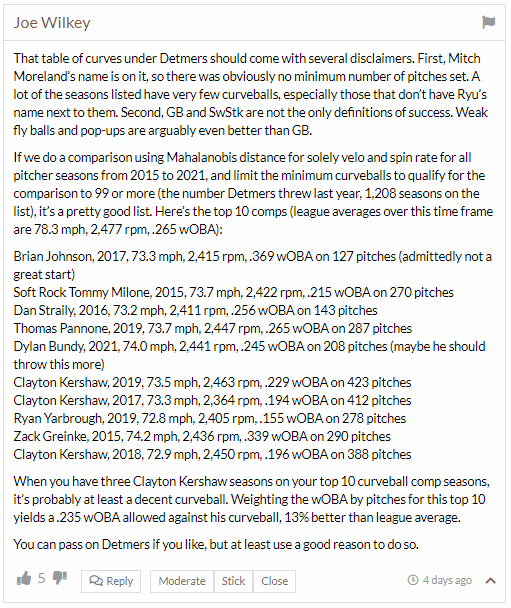
Simply, I shouldn’t be posting a new tool until it is nice and shiny. The above results were garbage and reader Joe Wilkey called me out.
My goal when creating the comps was to take small samples from last season and find comparable pitches. The deal is that I shouldn’t be including any small samples in the comparable list. I’m going to give some background on the tool and show the corrected results.
The end game for this tool is to find comparable pitches to a small sample of a pitch. The assumption is that the pitches will have similar results. Wilkey does utilize some results-based values (i.e. wOBA). I will use none of these for finding the comps. Once the comparables are found, I will average the results (GB% and SwStr%).
The parameters I used to find similar pitches are:
- Velocity
- Spin
- Horizontal Movement
- Vertical Movement
- Horizontal Release Point
- Vertical Release Point
- Release Extension
- Effective Velocity
Once I find the pitches, I averaged the groundball and swinging-strike rates to get the new pitch’s expected results. From this final value, I found the pitch’s pERA.
I wasn’t really finding great comparable pitchers so I had to change the coding around a bit. I can still pull from small samples but I only compare pitches that have been thrown over 100 times in a season. Here are the new improved results for Detmers.
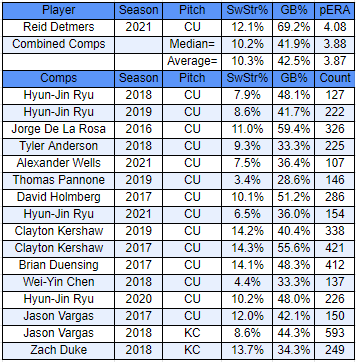
The results lineup up a little better with Wilkey with Kershaw(s) and Pannone making both lists. A pERA of ~4.00 isn’t elite, but average (link and link)
The tool wasn’t exactly created for Detmers who made several starts but more for someone like Luis Severino. In 2018, his fastball averaged 97.6 mph and 96.1 mph over 12 IP in 2019. This past season, it was at 95.3 mph in 6 IP. Here are the comps from 2018 and this past season.
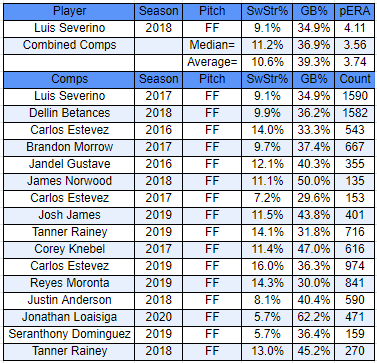
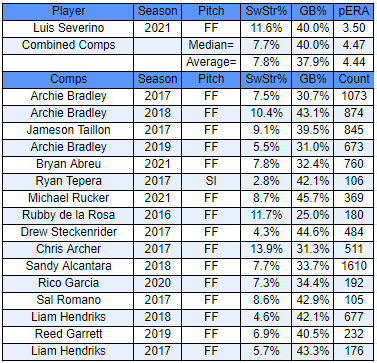
A pERA of about ~4.00 is pretty decent for fastball since the rest of the pitches generate all the swings and misses. The small sample of results this past season was decent, but the comps show that his swinging-strike rate should drop ~3% points. The pitch goes from above average to average. He will need to pick up some velocity in Spring Training to keep up the production.
The overall plan is to find some comps for new pitchers and/or pitches once the season starts. I’d like the process to be as smooth as possible so I can provide quick and easy answers. So, let me know if you have any questions and/or suggestions on the information.
Jeff, one of the authors of the fantasy baseball guide,The Process, writes for RotoGraphs, The Hardball Times, Rotowire, Baseball America, and BaseballHQ. He has been nominated for two SABR Analytics Research Award for Contemporary Analysis and won it in 2013 in tandem with Bill Petti. He has won four FSWA Awards including on for his Mining the News series. He's won Tout Wars three times, LABR twice, and got his first NFBC Main Event win in 2021. Follow him on Twitter @jeffwzimmerman.
Glad I could help Jeff! 😉
I really didn’t like using wOBA allowed as a metric, but I was trying to get some quick results. To be clear, I didn’t use it as an input, but I did use it incorrectly in the summary, as it is wOBA allowed on all pitches, not only wOBA on contact.
I have one question on this update, however. Depending on how you do the comparison, is it a good idea to include both velocity, and effective velocity? The correlation between velocity and effective velocity in the population of pitchers with 100 curveballs is nearly 0.95, so it seems like you’re double-dipping on velo, unless you’re using a method that accounts for covariance.
I might be double-dipping with the velocities. I need to think about it for a bit.