Does Ottoneu Arbitration Correlate to League Standings?
This one should be pretty quick. Chad has done all the heavy lifting analyzing how Ottoneu players handled the arbitration deadline last month; he presented a high-level recap and broke down arbitration by position. I was interested in taking a different approach: I wanted to confirm what my gut assumed to be true about which teams get allocated the most dollars during arbitration.
When I start the process of allocating dollars during the arbitration period, I usually begin by allocating a dollar to every team. You have to allocate at least a dollar to every team anyway, so I get that out of the way first. It’s also a good first step because I’ll often be torn between a number of players which tells me those roster deserve more dollars when I come back to allocate the rest of my funds. After that’s complete, I take a look at the final standings from the season and start allocating dollars to the top teams. Logically, the teams who finish higher in the standings should have rosters filled with players who have plenty of surplus value and need the help of the market to correct their salaries.
Do other Ottoneu players share this same inclination? The data says yes!
| Rank | Average Allocation |
|---|---|
| 1 | $27.9 |
| 2 | $26.1 |
| 3 | $26.1 |
| 4 | $24.8 |
| 5 | $23.8 |
| 6 | $23.3 |
| 7 | $22.0 |
| 8 | $21.3 |
| 9 | $20.8 |
| 10 | $19.9 |
| 11 | $18.0 |
| 12 | $17.2 |
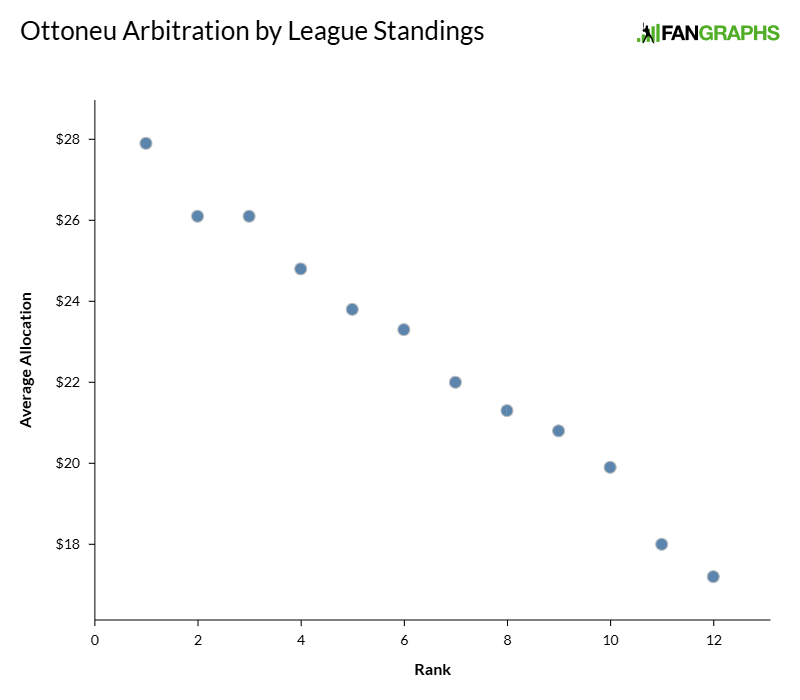
The shape of that scatter plot shouldn’t be all that surprising. The best teams in every league get allocated nearly $28 on average (with a maximum of $33) while the worst teams in every league get allocated more than $10 less. There are some clear breaks between third and fourth place and sixth and seventh place, and the placement of those gaps makes sense too. The top three teams in every league are probably loaded with talented players with lower than market value salaries and the top half of every league should have competitive teams while the bottom half of every league is likely filled with teams who are building for the future.
Is there anything actionable you can do with this knowledge? Probably not. If you’re finishing in the top three of your league, you’re probably expecting to get hit with a bunch of arbitration dollars at the start of the offseason. It might be a handy guide for planning if you’re trying to work out what your offseason budget is going to look like during the summer — you could toss in an expected allocation amount into your projected budget based on where you think you’re going to finish.
What if we flip the question around and ask if league standings tell us how many dollars a team will allocate.
| Rank | Average Allocated Dollars |
|---|---|
| 1 | $24.9 |
| 2 | $24.0 |
| 3 | $24.2 |
| 4 | $23.8 |
| 5 | $22.9 |
| 6 | $23.3 |
| 7 | $22.0 |
| 8 | $22.9 |
| 9 | $22.3 |
| 10 | $21.3 |
| 11 | $20.5 |
| 12 | $19.0 |
Again, not many surprises. The best teams — probably the most engaged teams in your league — allocate the most dollars to other teams during arbitration. This data really isn’t actionable, it’s more a reflection of league engagement. The better your team performs, the more incentive you have to ensure your team retains every ounce of competitive advantage over your rivals. That means making sure every one of your arbitration dollars are allocated to their maximum impact.
So this might not have been the most exciting dive into arbitration, but it’s good to have my instincts confirmed by the data.
Jake Mailhot is a contributor to FanGraphs. A long-suffering Mariners fan, he also writes about them for Lookout Landing. Follow him on BlueSky @jakemailhot.
What interests me is what do we do with our $8 to 20 guys who were slight bargains only to get mugged into Drop Land by a gang of allocators. I usually try to trade these overpriced names for a good, reasonably paid guy with upside. That often fails. But I will not trade for well below fair market value. It’s better to take a shot in auction which is a reset for the player within this league.
Arbitration brings up an interesting wrinkle for those borderline keepers. If a rival allocates dollars to a player that was already on your keep/cut bubble, cutting them at the keeper deadline essentially negates the salary cap penalty your rival was attempting to stick to you. You could attempt to redraft that cut player at a reasonable salary during the draft, and maybe your rival was trying to get you to cut that player so they could have a shot a drafting him too, but that’s a pretty inefficient use of arbitration dollars. If one of my rivals pushes one of my players into unkeepable territory, I’m happy to cut that player and essentially waste their arbitration allocation.
Plan A of arb allocation: Get your bids to last as long as possible i.e. bid up $3 stars who stay on one roster for five years.
Plan B: Identify players a rival cannot do without and make them inefficient (or a cut). Ideally, have room and need for that same player on your roster, allowing you to bid that player up and either take him or force your rival to overpay.
Of course, anticipating bidding behavior in November is a fraught endeavor.
Yeah I don’t see a dropped, very expensive player as wasted arb allocation. Pushing Skenes >$60, Judge >$75, or Ohtani >$95 makes these guys really tough keeps. Either the owner bites the bullet and rosters them or they hit the draft where presumably they will not go as high.
$75-80 is actually fair value for Judge. I highly recommend checking out the Ottoneu surplus calculator, which helps peg what players are truly worth (beyond just what the market says they’re worth).