Defying the Aging Curve
A few days ago, I saw this post from Eno Sarris:
Farhan Zaidi on older player value. “I don’t know that the old aging curves are especially helpful now. Players work on themselves year round in a way they didn’t. Actuarial results gleaned from census or overall data may be less valuable than what we know about the individual.”
— Eno Sarris (@enosarris) August 13, 2021
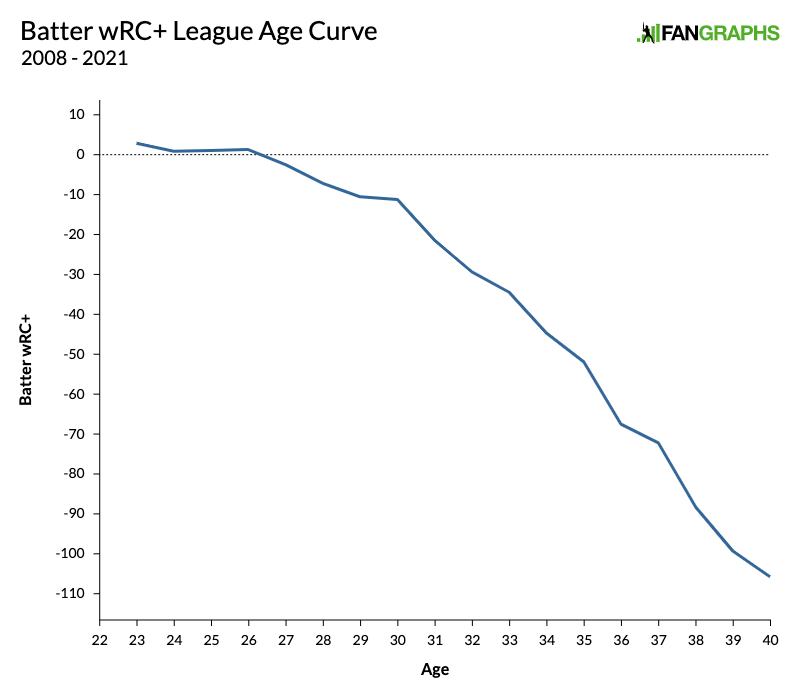
Zaidi’s mention of the “old aging curves” led me down an aging curves rabbit hole, where I read excellent posts from Mitchel Lichtman on creating aging curves (part 1 and part 2) and a few more recent studies by Jeff Zimmerman. I created my own aging curve using wRC+ as the metric and I looked to see where the Giant’s players fell on the line. Using the same techniques as described by Lichtman and Zimmerman, I used the delta method on all players who recorded at least 10 plate appearances in each season between 2008 and today. Here is the league-wide aging curve including the current year:
Once I created the overall league aging curve, I went through the exact same process on a player-by-player basis and graphed a players’ cumulative difference of wRC+ from year to year. But, when you average all players with back-to-back year performances, the line becomes much smoother and on a different scale than one individual player who has performed well enough to stick around for a while. In order to make better sense of the league average compared to an individual player, I used a min/max scaler to bring the lines closer together. Remember that what you’re seeing is the cumulative difference graphed and that I’ve scaled it. So, you might think, “Well player A was at league average (100 wRC+) in year B, but he’s below the league average (blue line). How does that make sense?” But, the accumulation of wRC+ over the years, and not season by season wRC+, is what we’re looking at. Here are three Giant’s players who seem to be tricking father time, for now:
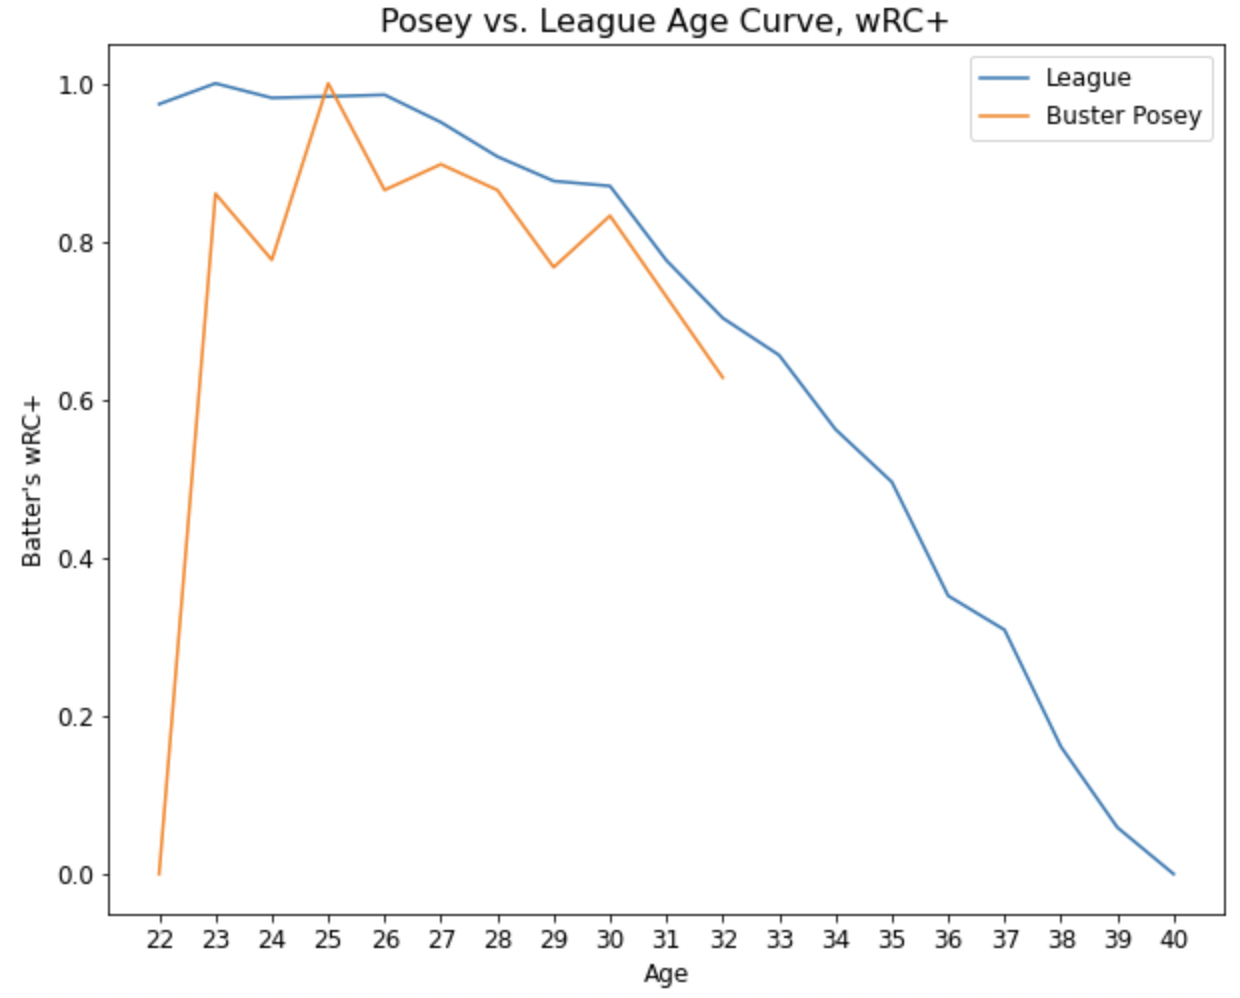
Giant’s fans may remember Posey debuting in 2009 and posting a -51 wRC+ in only 17 plate appearances at the tender age of 22. By the end of the 2010 season, however, he posted a 134 wRC+ and things have been going well ever since. You’ll notice I’ve left his current wRC+ out and he appears to be following the league-wide age curve very closely. Head over to the 2021 leaderboards, and you’ll also notice Posey leads all catchers with at least 300 plate appearances with a 159 wRC+. Behind Posey and in second place with the same qualifiers is Will Smith at 135. If I were to include a blank space for 2020 (Posey opted out) and his current wRC+, you would see his graph looking much like the next two.

Crawford has surprised many people this year. He finds himself with the highest current wRC+ among qualified shortstops at 141, just ahead of Xander Bogaerts who has 138. In his age 34 season, Crawford has absolutely spiked. Back in 2019, Crawford was on his way down the age curve’s slippery slope, collecting a 73 wRC+. But, he finished 2020 with a 111 wRC+, good for 12th place among qualified shortstops. So he showed signs of improvement before the current season. Should we have seen 2021 coming? Did you? Why didn’t you tell us?

Lastly, Evan Longoria has had a roller coaster ride through father time’s magical mystery theme park. Between 2018 and 2019, his age 32 and 33 seasons respectively, Longoria jumped from an 86 wRC+, good for 19th place among qualified third basemen, to exactly league average (100). He dipped back down in 2020 (93 wRC+) before jumping on the Giant’s private wRC+ space elevator on his way up to a current 145 wRC+, good for (you guessed it) first place among all third basemen with at least 150 PAs. That’s a much smaller sample, but Longoria has dealt with injuries in 2021 and it’s hard to say what would have happened had he stayed healthy.
The league wRC+ aging curve still shows us that players seemingly enter the league at their peak and decline from there. However, there will be players that don’t fit that trend, it is just an average or a line of best fit. But, this Giants team may just change the way we think about aging in the fantasy baseball world entirely. To be honest, I’m not sure we’ve ever really had a consensus on the subject. While many will ask, “What are they doing differently in San Francisco?”, this analysis leads me to further work prospects where automated data analysis will flag players who jump above the blue line. Is this a consequence of new technology, better data, really good coaches, a culture change that promotes total buy-in? Who knows? Just as we try to predict a break out performance from a young developing player, we may need to start looking for the older, veteran players who we can predict as having curve defying seasons.
1. I’m not saying it’s steroids, but this is pretty much what is says (some) steroids do on the tin.
2. there’s a market inefficiency for old players, maybe. I think you’re on to some thing here. The issue is ruling out survivorship.
3. The Giants have always done this, right? Maybe there’s something organizational that was set up under Sabean that lets them identify and nurture these guys.
Do steroids prolong a career, or do they shorten it? I’ve heard both – steroids are bad because they cause your body to break down. But they also help recovery. Which is it, and what is the evidence for each?
If you are looking for statistical evidence of steroid usage, you’re going to have to try harder. Dan Szymborski has looked many times, including using a dummy variable amongst known offenders, but hasn’t found anything in the stats that would be useful. Many others have done deep dives on the data, without anything conclusive. Looking at an article about how 3 players are outperforming expectations, then raising the specter of steroids, is irresponsible.
Please don’t post shallow takes on steroids. This isn’t 2006 any more.
None of these players have more than 400 PA, though. Who’s to say if this is their actual talent level? Using the sample size widget on this site, for Brandon Crawford’s wOBA/PA, the 95% confidence interval goes from .315 to .388, which is a wRC+ range between 100 and 145. I’m going to pick on Crawford here, but there’s sure to be some weirdness for all of these guys.
First, some historical context. I looked at players in the last 50 years spanning either their age 32-34 seasons or age 33-35 seasons, trying to account for the semi-lost 2020. Players had to have at least 300 PA every year. Twelve players posted a wRC+ less than 80 in year 1 and over 100 in year 2. Their median wRC+ in those three years: 76, 111, and 102. The interesting comp here is Aubrey Huff from 2009 to 2011 (ages 33-35), who went 77, 144, 89.
If you look at Crawford’s 2019 season compared to this year, he has increased his swinging strike rate by 1.6 points and increased his FB rate by 15 points, yet his batting average has jumped 72 points. He is clearly trying to add power at the expense of contact (his barrel rate is up to 14.0% this year compared to a pitiful 4.4% in 2019), but my guess is pitchers haven’t quite changed to adapt to his modified approach yet.
I don’t think you can say that the Giants are finding players/have a system to defy the aging curve based on three players who have totaled 910 PA this year. Weird stuff happens in half-seasons, probably even more so after a strange season like 2020.
Yeah what you’re seeing is almost certainly just random variation. Crawford is definitely the most extreme but the others had preseason wRC+ projections that had them as average to above average hitters. Average to above average true talent hitters having a really good season happens all the time.
I do wonder how much the shortened season last year helped. All three guys (plus Belt) got most of if not an entire year off without the distraction of an injury.
At the same time, I deeply enjoy Zaidi getting rounds of praise for the successes of the exact guys whose contracts got Bobby Evans sacked.
This isn’t really any different than any other business. One manager hires a team, they underperform, new manager comes in and gets more production out of the same employees.
Signing a player and getting production that equals or exceeds the value of that contract are two different things.
I’d actually go one step further than this, and say that something about the team and staff Evans put together wasn’t just optimizing the players, it was creating an active impediment to their successes. The Giants almost to a player underperformed ZIPs for two years until ZIPs finally got around to going, “Right, okay, these dudes suck.” Not to say that I have any idea what it is, but the WS core fell off a cliff in unison, with the exception of Bumgarner, who fell off a dirtbike then off a cliff.
Dayton Moore is defying the firing curve….should have been fired years ago! Fire Dayton Moore!